Fig. 4
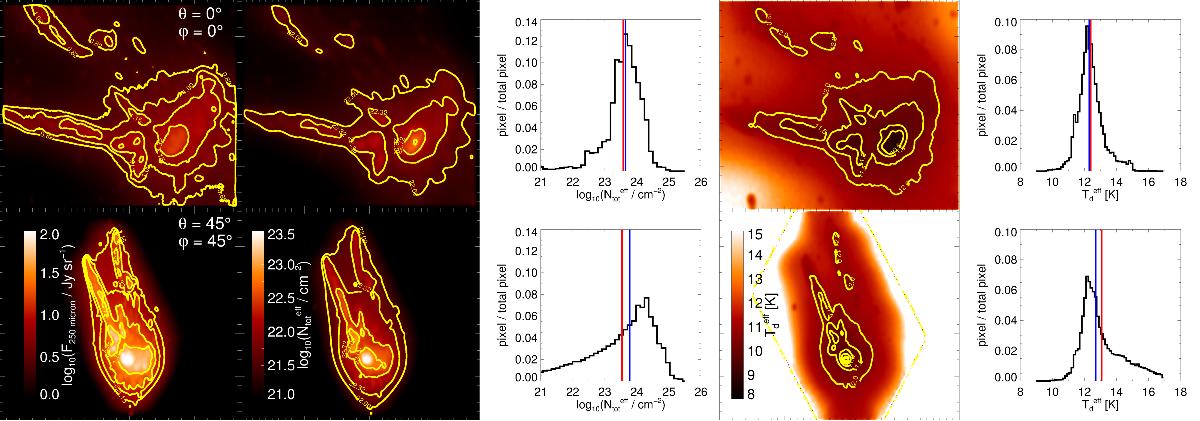
Results based on the ρ Ophiuchi cloud model at (θ, ϕ) = (0°, 0°) (top) and (θ, ϕ) = (45°, 45°) (bottom). From left to right the figures show the maps of synthetic intensity at 250 μm, maps of effective total column density with corresponding PDFs, and the maps of effective dust temperature with corresponding PDF. The contours in the maps are at ![]() {0.82,1.0,1.15,1.32,1.5},
{0.82,1.0,1.15,1.32,1.5}, ![]() {22.0,22.32,22.72,23.0}, and
{22.0,22.32,22.72,23.0}, and ![]() {10.5,11.0,11.5,12.0} K. The red lines in the PDFs indicate the arithmetic mean values of the distributions, the blue lines the median values.
{10.5,11.0,11.5,12.0} K. The red lines in the PDFs indicate the arithmetic mean values of the distributions, the blue lines the median values.
Current usage metrics show cumulative count of Article Views (full-text article views including HTML views, PDF and ePub downloads, according to the available data) and Abstracts Views on Vision4Press platform.
Data correspond to usage on the plateform after 2015. The current usage metrics is available 48-96 hours after online publication and is updated daily on week days.
Initial download of the metrics may take a while.