Fig. 3
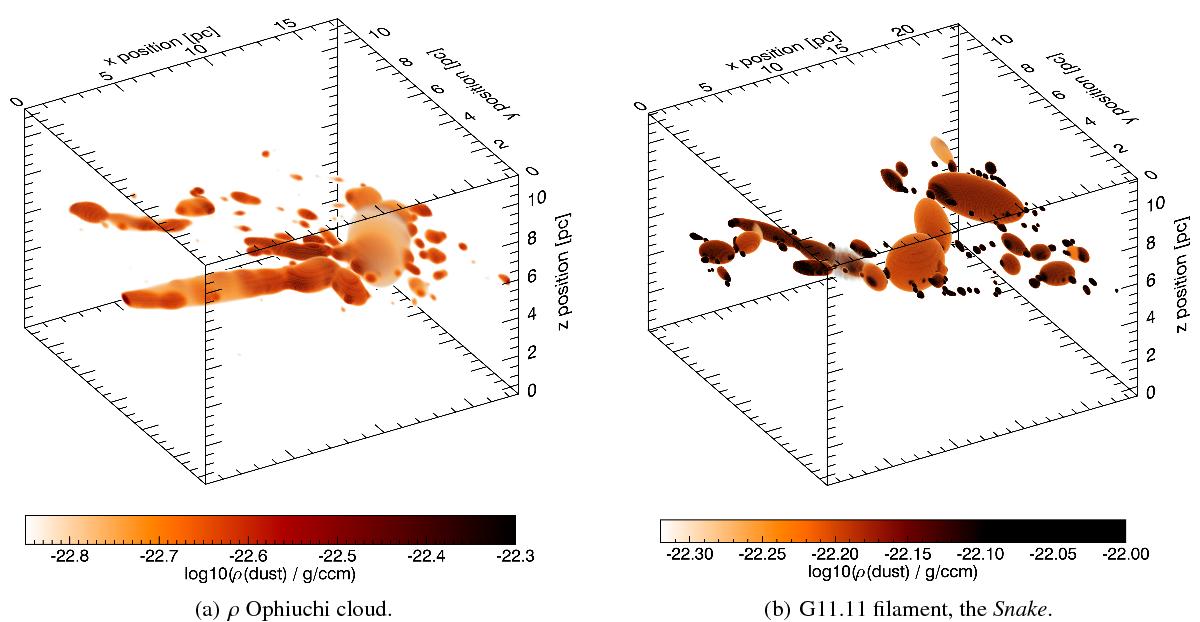
3D images of the dust density distribution of the ρ Ophiuchi (based on Kainulainen et al. 2009) and G11.11 models (based on Kainulainen et al. 2013). The models consist of a number of small, dense clumps that are surrounded by diffuse envelopes. Note that we only plot the most dense parts of the models and not the more diffuse envelopes since those would obscure the central clumps and cores. The real range of total column densities and dust temperatures are summarised in Table 3.
Current usage metrics show cumulative count of Article Views (full-text article views including HTML views, PDF and ePub downloads, according to the available data) and Abstracts Views on Vision4Press platform.
Data correspond to usage on the plateform after 2015. The current usage metrics is available 48-96 hours after online publication and is updated daily on week days.
Initial download of the metrics may take a while.