Fig. 2
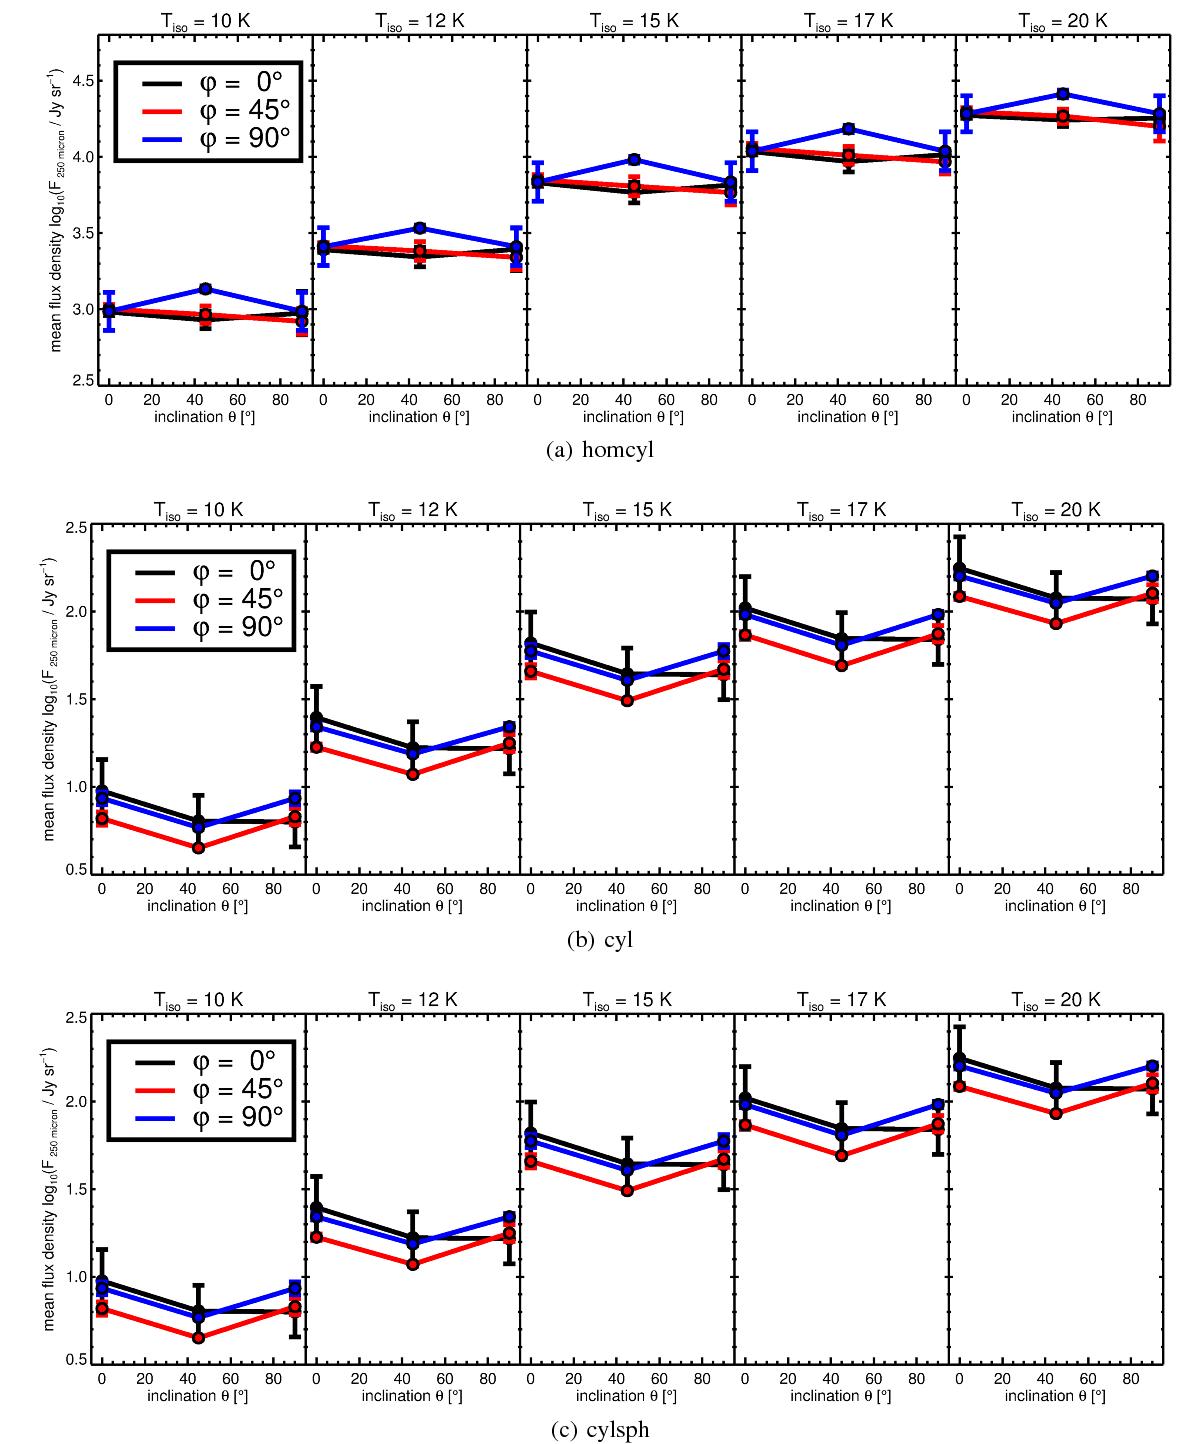
Mean flux density, log 10(![]() ), of homcyl, cyl, and cylsph as function of temperature, inclination, and position angle. The error bars illustrate the errors of the mean value. We present the results for θ and ϕ at 0°, 45° and 90°. The lines are interpolations that represent the true values well. Note that the curves for ϕ = 45° and 90° may overlap in Figs. 2b and c.
), of homcyl, cyl, and cylsph as function of temperature, inclination, and position angle. The error bars illustrate the errors of the mean value. We present the results for θ and ϕ at 0°, 45° and 90°. The lines are interpolations that represent the true values well. Note that the curves for ϕ = 45° and 90° may overlap in Figs. 2b and c.
Current usage metrics show cumulative count of Article Views (full-text article views including HTML views, PDF and ePub downloads, according to the available data) and Abstracts Views on Vision4Press platform.
Data correspond to usage on the plateform after 2015. The current usage metrics is available 48-96 hours after online publication and is updated daily on week days.
Initial download of the metrics may take a while.