Fig. 1
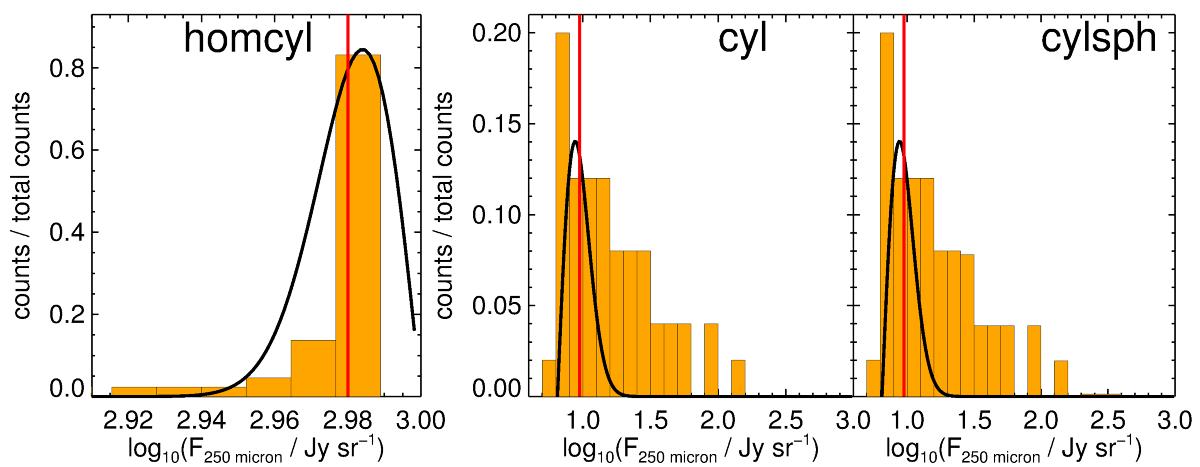
PDFs showing the 250 μm flux density, F250 μm. From left to right, the plots show the PDFs of the homcyl, cyl, and cylsph models, all at (θ, ϕ) = (0°, 0°) and Tiso = 10 K. The black lines show the Rayleigh distributions fitted to the PDFs. The fitted mean values are marked with red lines. These plots illustrate how the flux density is concentrated towards the upper (homcyl) or lower range (cyl, cylsph) of the distributions.
Current usage metrics show cumulative count of Article Views (full-text article views including HTML views, PDF and ePub downloads, according to the available data) and Abstracts Views on Vision4Press platform.
Data correspond to usage on the plateform after 2015. The current usage metrics is available 48-96 hours after online publication and is updated daily on week days.
Initial download of the metrics may take a while.