Fig. 5
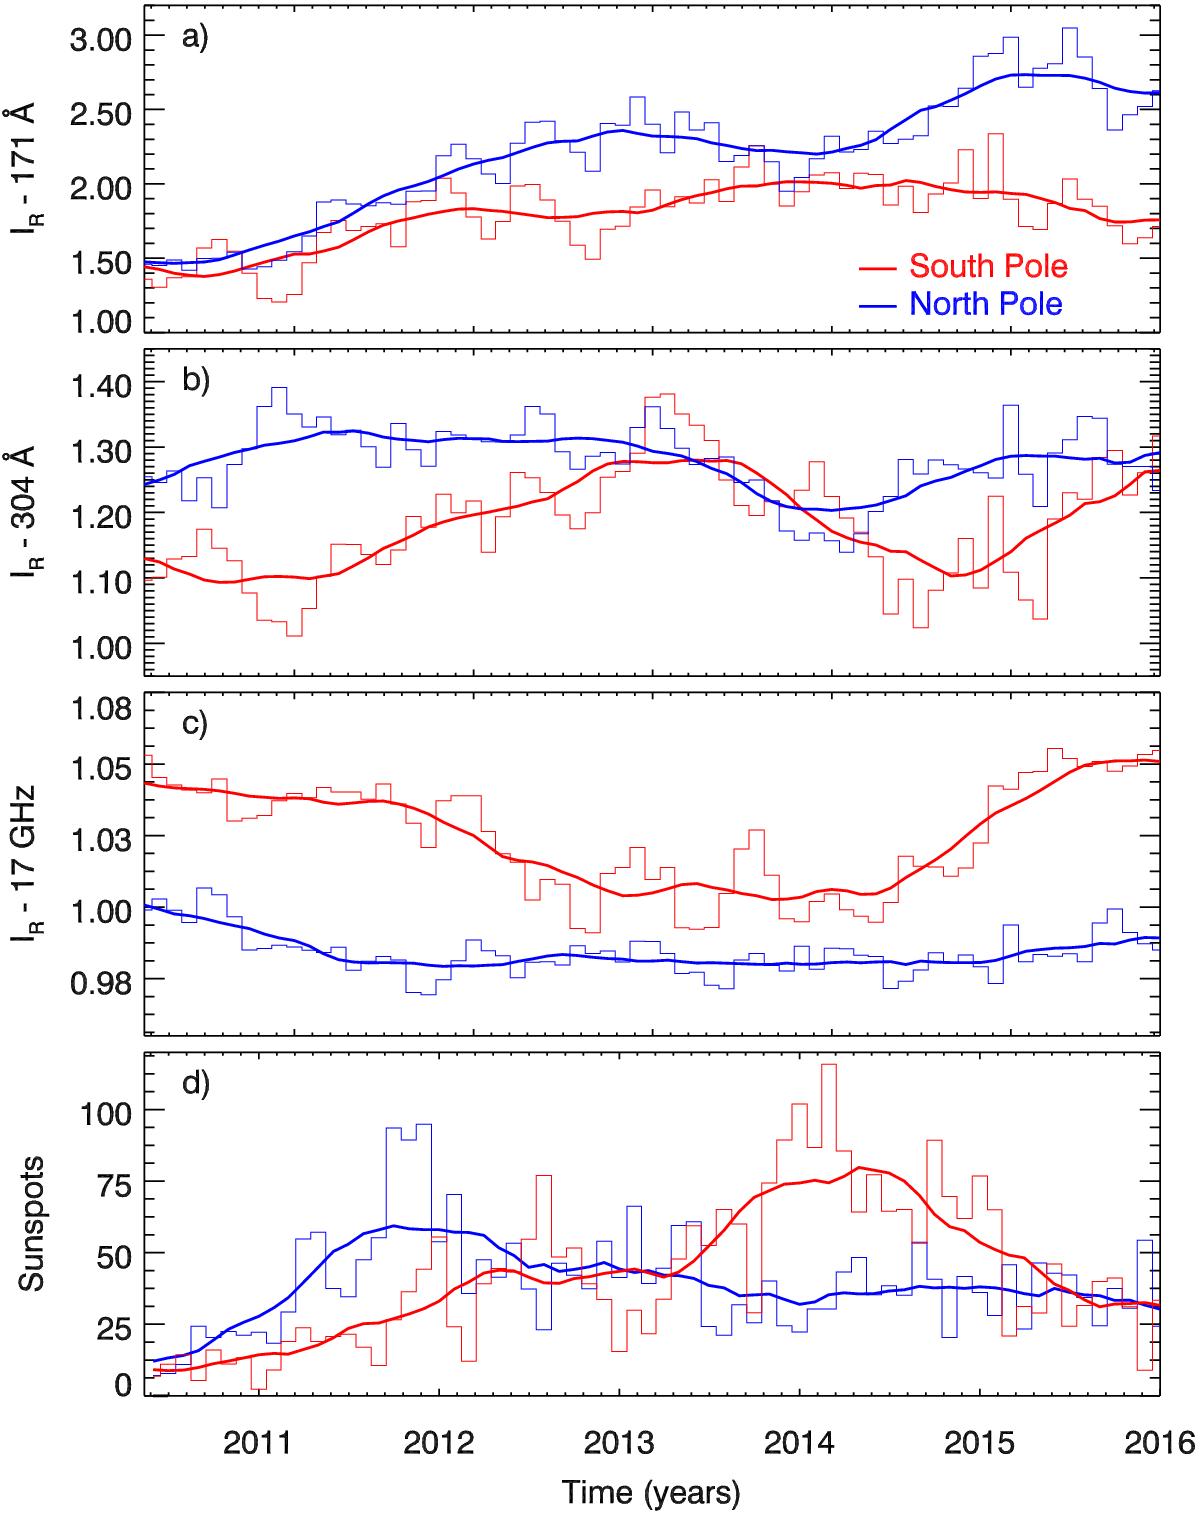
Monthly mean polar IR variations at a) 171 Å, b) 304 Å and c) 17 GHz. For comparison the monthly sunspot numbers for each hemisphere were plotted in panel d). The daily south (red curves) and north (blue curves) means IR were calculated in the regions 60−120° and 240−300°, respectively.Yearly running means (12 points) were applied to the values (thick lines).
Current usage metrics show cumulative count of Article Views (full-text article views including HTML views, PDF and ePub downloads, according to the available data) and Abstracts Views on Vision4Press platform.
Data correspond to usage on the plateform after 2015. The current usage metrics is available 48-96 hours after online publication and is updated daily on week days.
Initial download of the metrics may take a while.