Fig. 1
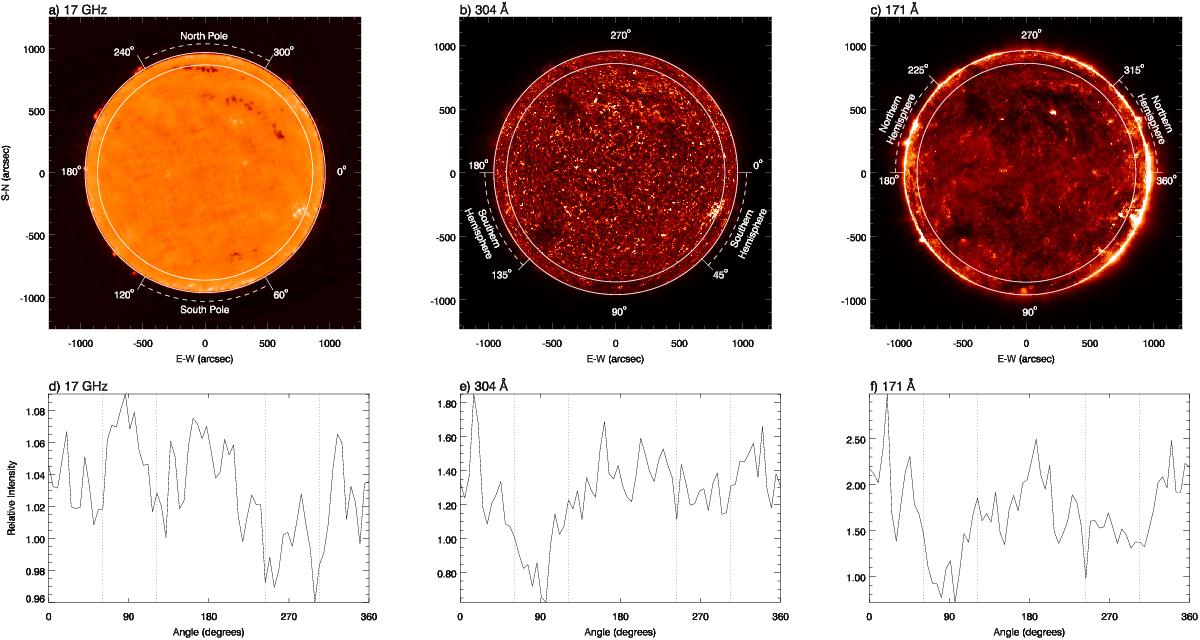
Solar images observed at a) 17 GHz; b) 304 Å; and c) 171 Å. The concentric circles delimited the analyzed regions and the dashed arcs demarcated the polar regions a), the equatorial southern b) and northern c) hemispheres, respectively. The mean relative intensities (IR) resulting from the analyses for the three wavelengths are shown in the bottom panels (d), e) and f)). The south and north poles were delimited in the ranges 60−120° and 240−300°, respectively (dotted lines in the panels).
Current usage metrics show cumulative count of Article Views (full-text article views including HTML views, PDF and ePub downloads, according to the available data) and Abstracts Views on Vision4Press platform.
Data correspond to usage on the plateform after 2015. The current usage metrics is available 48-96 hours after online publication and is updated daily on week days.
Initial download of the metrics may take a while.