Fig. 5
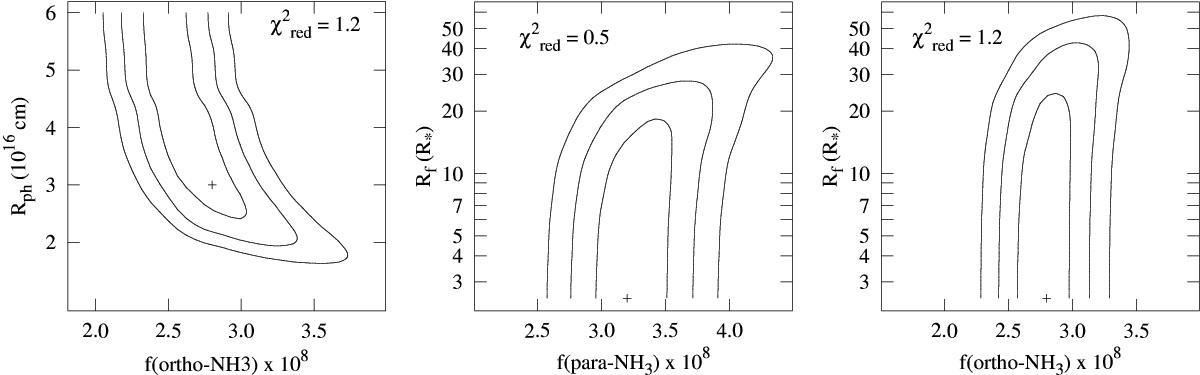
Contours of χ2, indicating the sensitivity of the fit to the model’s free parameters. The left panel shows the dependence of χ2 on the photodissociation radius Rph and abundance of ortho-NH3, given the best fitting value for the formation radius, Rf = 2.5 R⋆. The middle and the right panels show the dependence of χ2 on the formation radius Rf and the abundances of para- and ortho-NH3, given a photodissociation radius Rph = 3 × 1016 cm. The contours correspond to 1, 2, and 3σ confidence levels. The best fits are marked with a cross and the corresponding ![]() are shown on the plots.
are shown on the plots.
Current usage metrics show cumulative count of Article Views (full-text article views including HTML views, PDF and ePub downloads, according to the available data) and Abstracts Views on Vision4Press platform.
Data correspond to usage on the plateform after 2015. The current usage metrics is available 48-96 hours after online publication and is updated daily on week days.
Initial download of the metrics may take a while.