Fig. 4
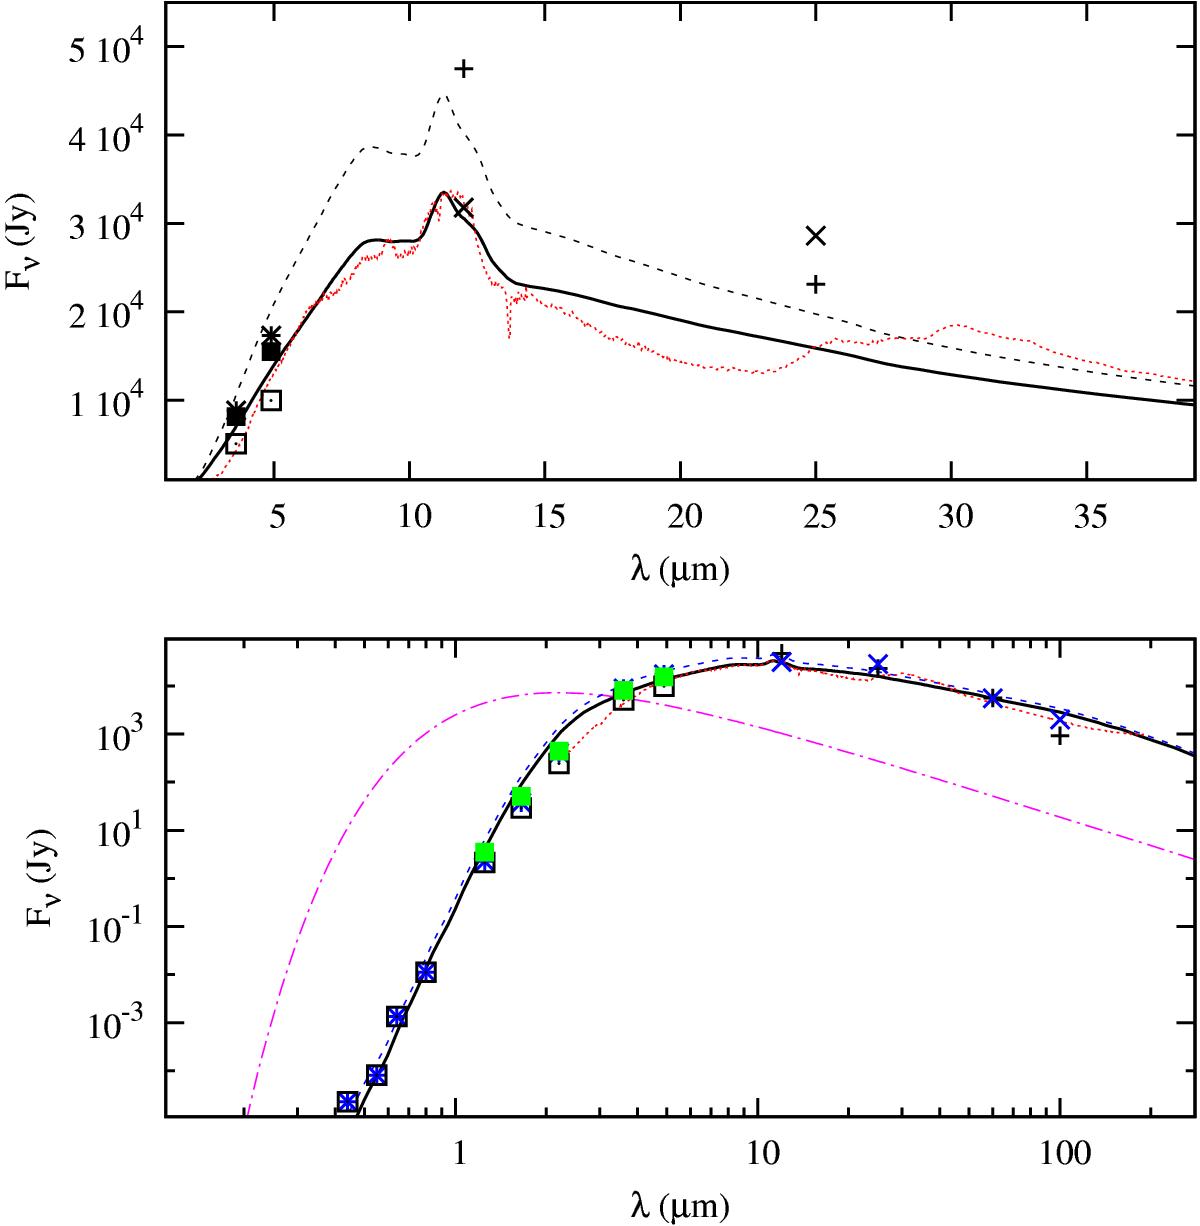
Fit to the flux for Lavg = 8500 L⊙ and effective temperature of 2300 K is shown in both panels by black solid line. The contribution from the central star is shown in the bottom panel by the dash-dotted magenta line. SWS and LWS ISO spectra are shown by red dotted lines. Photometric data below 1 μm are from GSC 2.3, those between 1.25 and 5 μm are from Le Bertre (1992) at three different phases: 0.02 (stars), 0.21 (filled squares) and 0.23 (dotted squares), while at longer wavelengths the flux is from IRAS (crosses) and COBE DIRBE (x) measurements. The dust model obtained for Lmax = 11 850 L⊙ is shown by dashed lines on each panel (see text for details).
Current usage metrics show cumulative count of Article Views (full-text article views including HTML views, PDF and ePub downloads, according to the available data) and Abstracts Views on Vision4Press platform.
Data correspond to usage on the plateform after 2015. The current usage metrics is available 48-96 hours after online publication and is updated daily on week days.
Initial download of the metrics may take a while.