Fig. 3
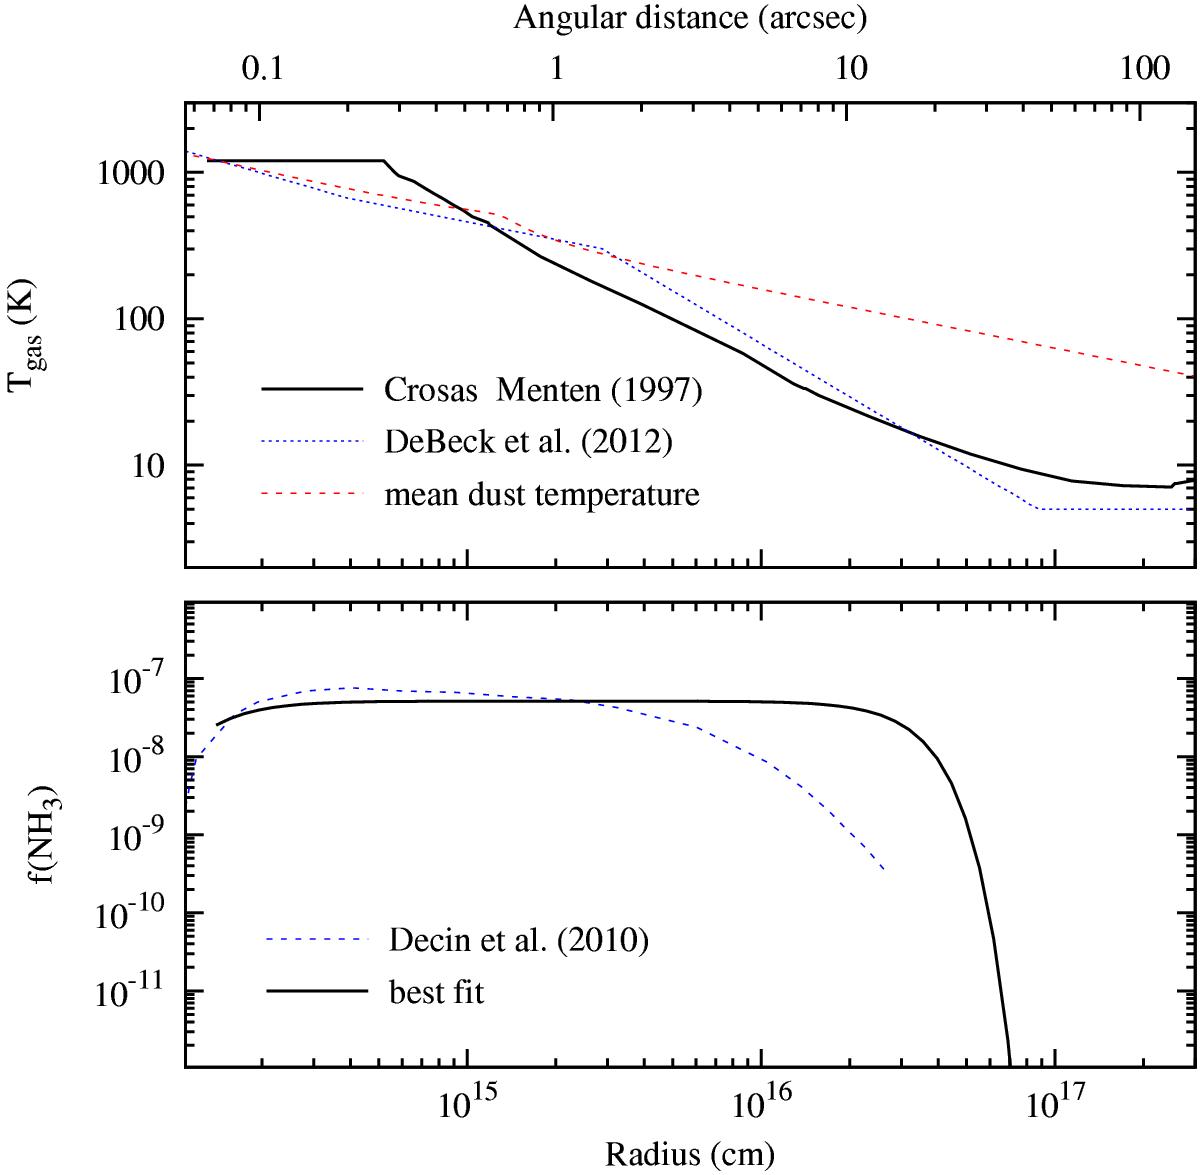
Gas temperature within the envelope of IRC+10216 adopted for this work (upper panel) from Crosas & Menten (1997) is shown by a solid line, while that from De Beck et al. (2012) is shown by a blue dotted line. The dust temperature is shown by a red dashed line. The lower panel shows the distribution of ammonia from our best fitting models (solid line), and its theoretical distribution (dashed line) from Decin et al. (2010). The angular distance is given in the top axis of the upper panel for an assumed distance to IRC+10216 of 130 pc.
Current usage metrics show cumulative count of Article Views (full-text article views including HTML views, PDF and ePub downloads, according to the available data) and Abstracts Views on Vision4Press platform.
Data correspond to usage on the plateform after 2015. The current usage metrics is available 48-96 hours after online publication and is updated daily on week days.
Initial download of the metrics may take a while.