Fig. 2
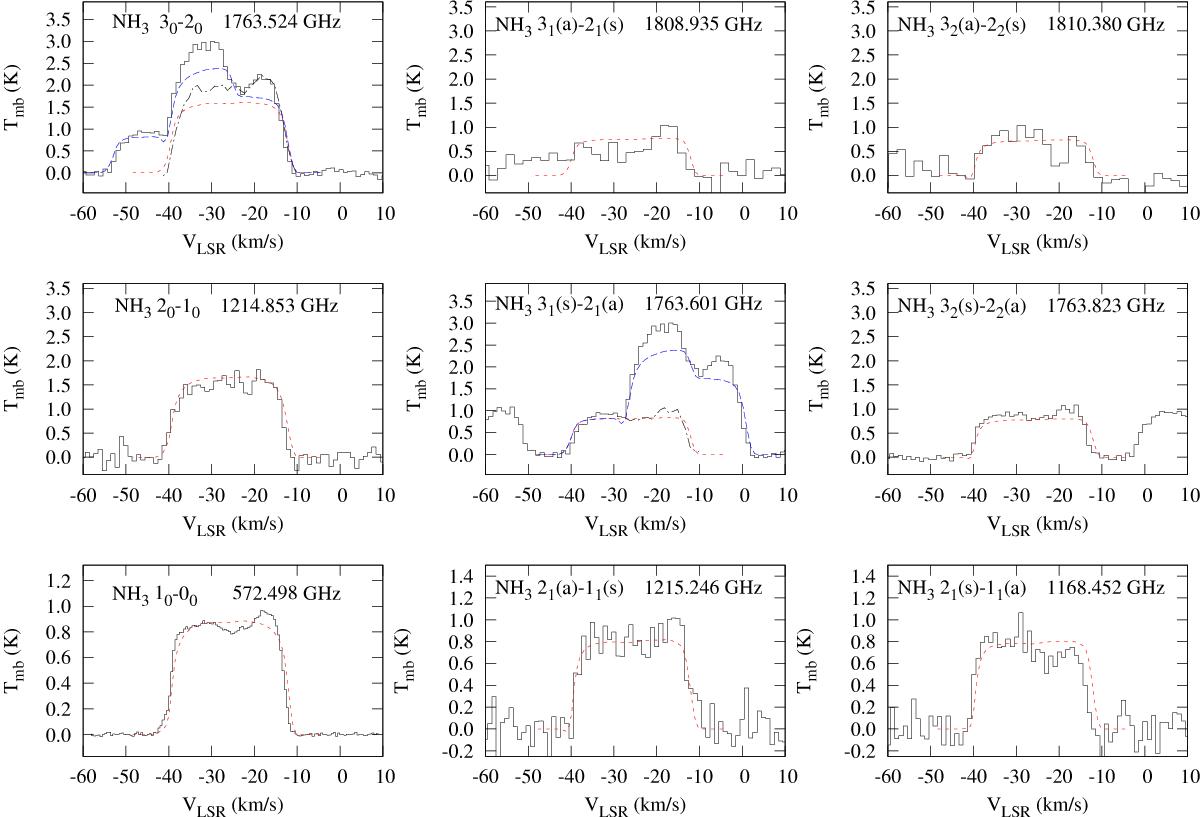
HIFI observations of rotational transitions of ortho-NH3 (left column) and para-NH3 (middle and right columns) are shown by solid lines. Approximated line profiles (see Sect. 2.2) of two blended lines 30(s)−20(a) and 31(s)–21(a) are shown by dot-dashed lines. Emission profiles are overplotted with theoretical profiles (red dashed lines) from our best fit models computed separately for each ammonia spin isomer. The effect of line overlapping in case of the two blends is shown with blue dashed lines. The theoretical profiles for the three lines that were observed at phase φ= 0.13 (see Table 1) are rescaled up to mimic computations at phase φ= 0.23 (see Sect. 4.5 for details). Our approach in searching for the best fit is described in Sect. 4.5, and the best fitting parameters are compiled in Table 2.
Current usage metrics show cumulative count of Article Views (full-text article views including HTML views, PDF and ePub downloads, according to the available data) and Abstracts Views on Vision4Press platform.
Data correspond to usage on the plateform after 2015. The current usage metrics is available 48-96 hours after online publication and is updated daily on week days.
Initial download of the metrics may take a while.