Free Access
Fig. 6

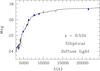
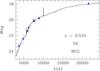
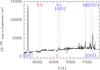
Spectral energy distribution fitted on the available u*, g′, r′, i′, z′, and Ks magnitudes (3σ error bars are also shown). Adopted redshift and best-fit model are given in each case. Upper figure: diffuse light, middle figure: BCG. The lower figure is the MUSE spectrum of the BCG.
This figure is made of several images, please see below:
Current usage metrics show cumulative count of Article Views (full-text article views including HTML views, PDF and ePub downloads, according to the available data) and Abstracts Views on Vision4Press platform.
Data correspond to usage on the plateform after 2015. The current usage metrics is available 48-96 hours after online publication and is updated daily on week days.
Initial download of the metrics may take a while.