Fig. 10
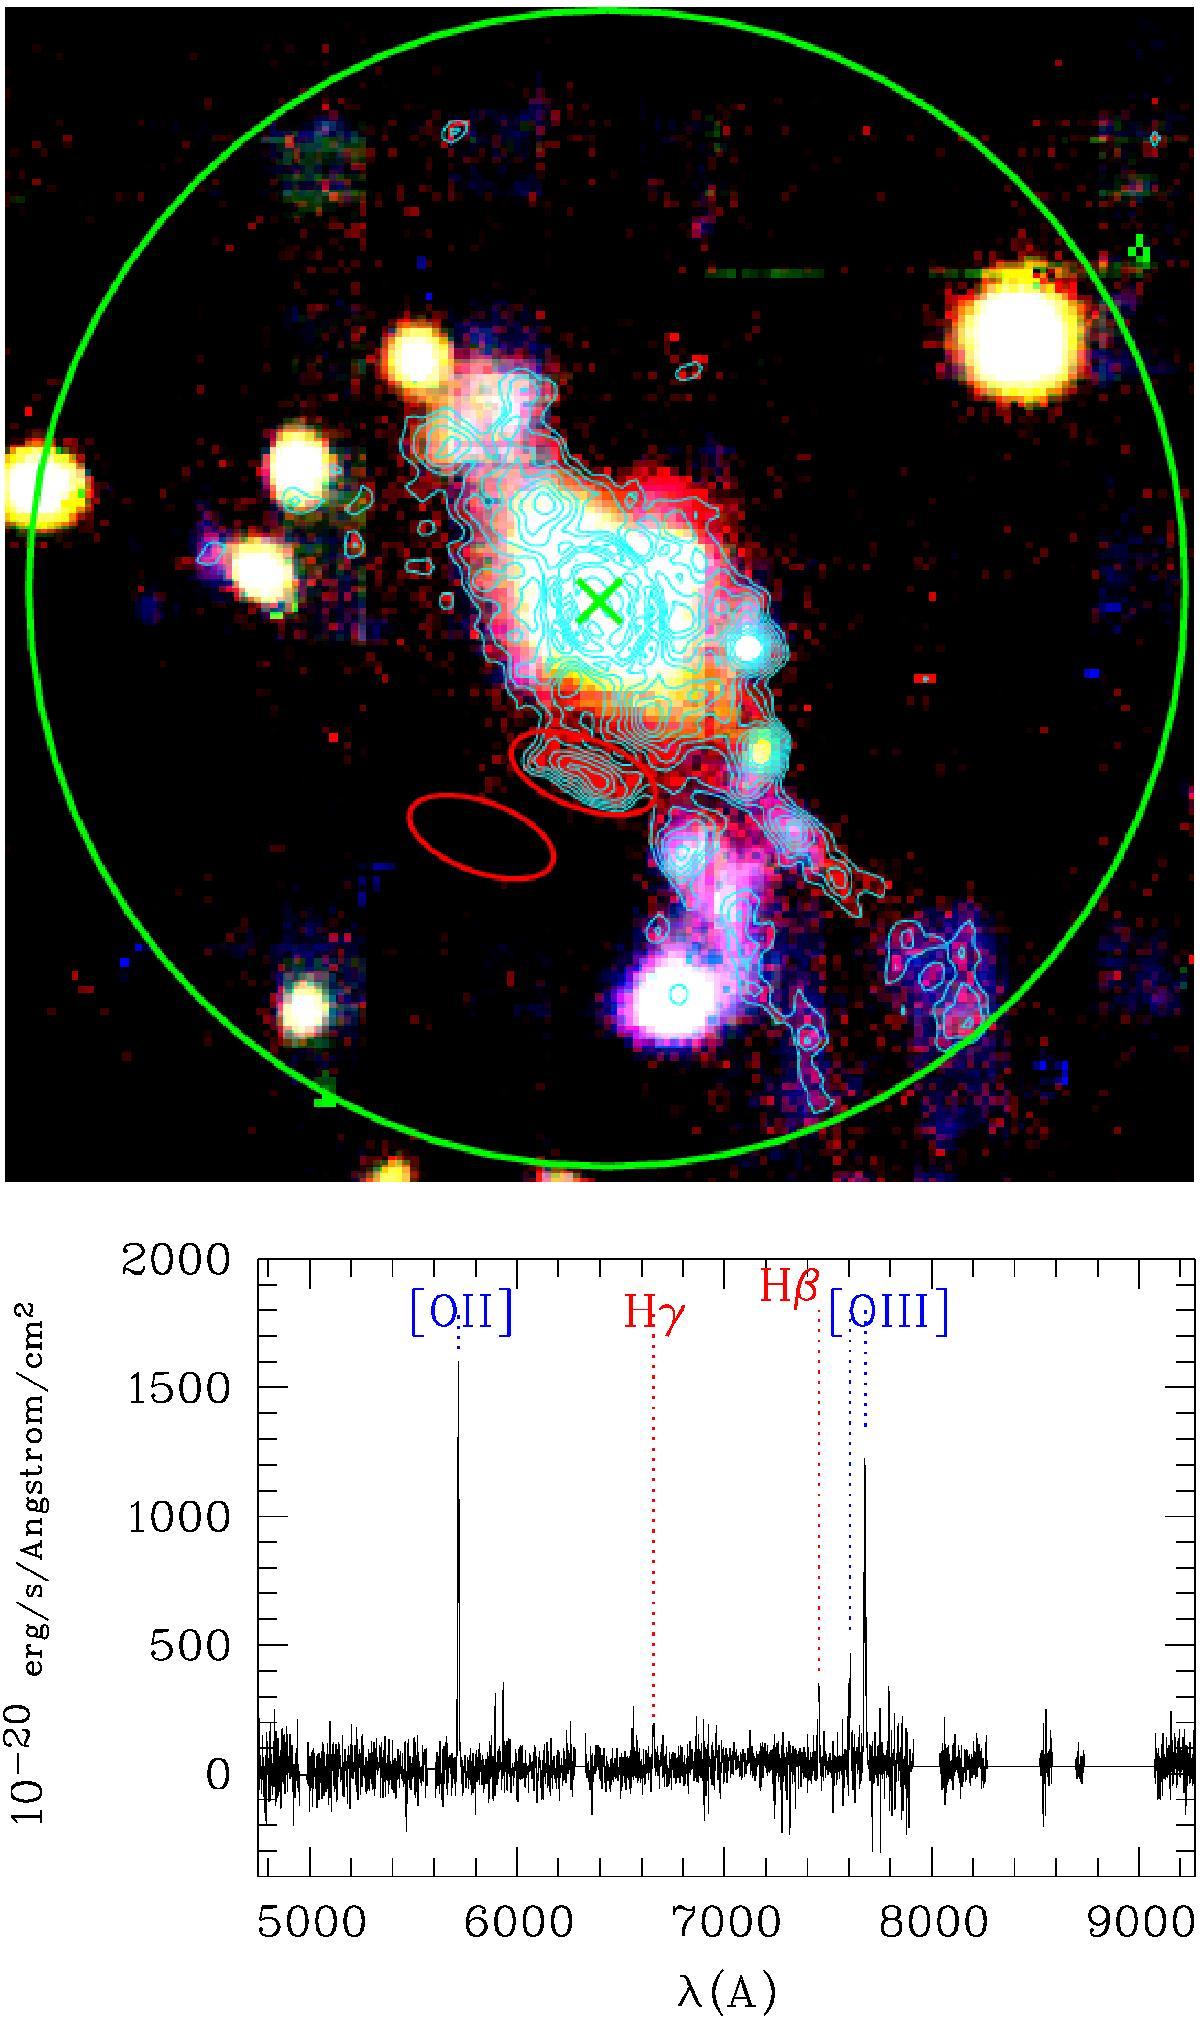
Upper figure: trichromic image of the ELDL area (blue is for V-band MUSE reconstructed image, green for the I-band MUSE reconstructed image, and red is the narrowband [OII]+Hβ+[OIII] MUSE reconstructed image). Upper red ellipse is the area where the spectrum of ELDL was extracted and lower ellipse is the region where the background was estimated. The large green circle is a 100 kpc radius region and the green cross is the position of the BCG. [OII]+Hβ+[OIII] residual image from OV_WAV is shown as cyan contours. These contours start at the 2.5σ level and progress by steps of 0.5σ. Lower figure: calibrated spectrum of the ELDL.
Current usage metrics show cumulative count of Article Views (full-text article views including HTML views, PDF and ePub downloads, according to the available data) and Abstracts Views on Vision4Press platform.
Data correspond to usage on the plateform after 2015. The current usage metrics is available 48-96 hours after online publication and is updated daily on week days.
Initial download of the metrics may take a while.