Fig. 1

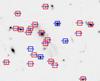
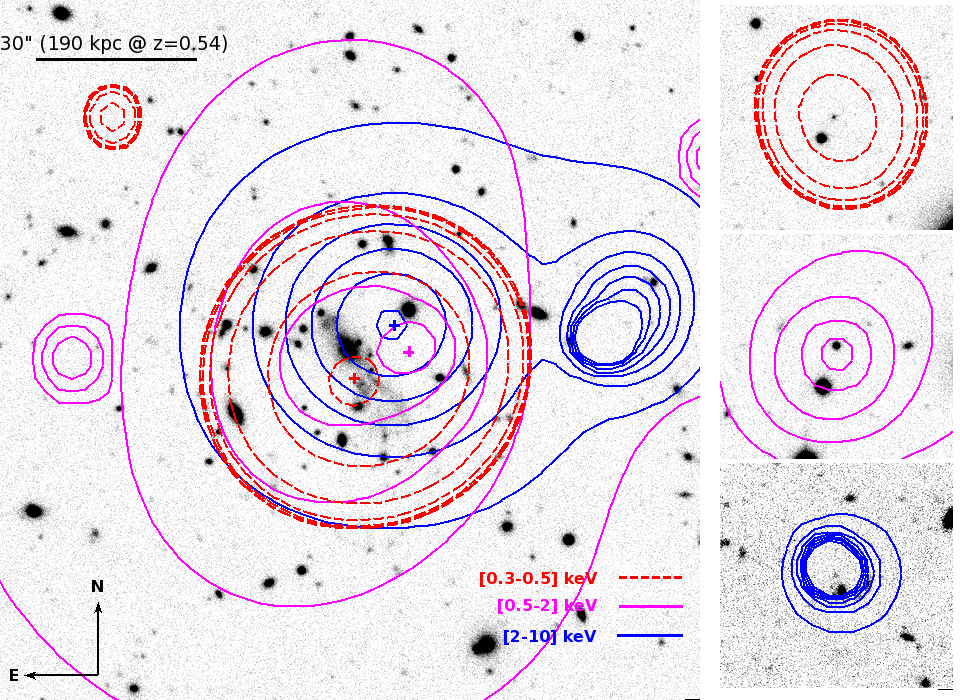
Upper figures: X-ray morphology of XLSSC 116 as a function of energy band. The image is CFHT-LS i′ with X-ray contours overlaid. Crosses indicate the position of the surface brightness peak in each selected sub-band. The right panels show three point-sources in the vicinity of XLSSC 116 with spatial scales and contour levels matching those of the main image. They illustrate the size of the XMM-Newton PSF at the location of the cluster. We note the presence of a point-source in the [2−10] keV band west of the cluster centre. This source is masked out in the X-ray analyses. Lower figure: zoom on the same i′ image with Serna-Gerbal substructure 1 shown as red squares and substructure 2 shown as blue squares (see below). Galaxy redshifts are also shown.
Current usage metrics show cumulative count of Article Views (full-text article views including HTML views, PDF and ePub downloads, according to the available data) and Abstracts Views on Vision4Press platform.
Data correspond to usage on the plateform after 2015. The current usage metrics is available 48-96 hours after online publication and is updated daily on week days.
Initial download of the metrics may take a while.