Fig. B.2
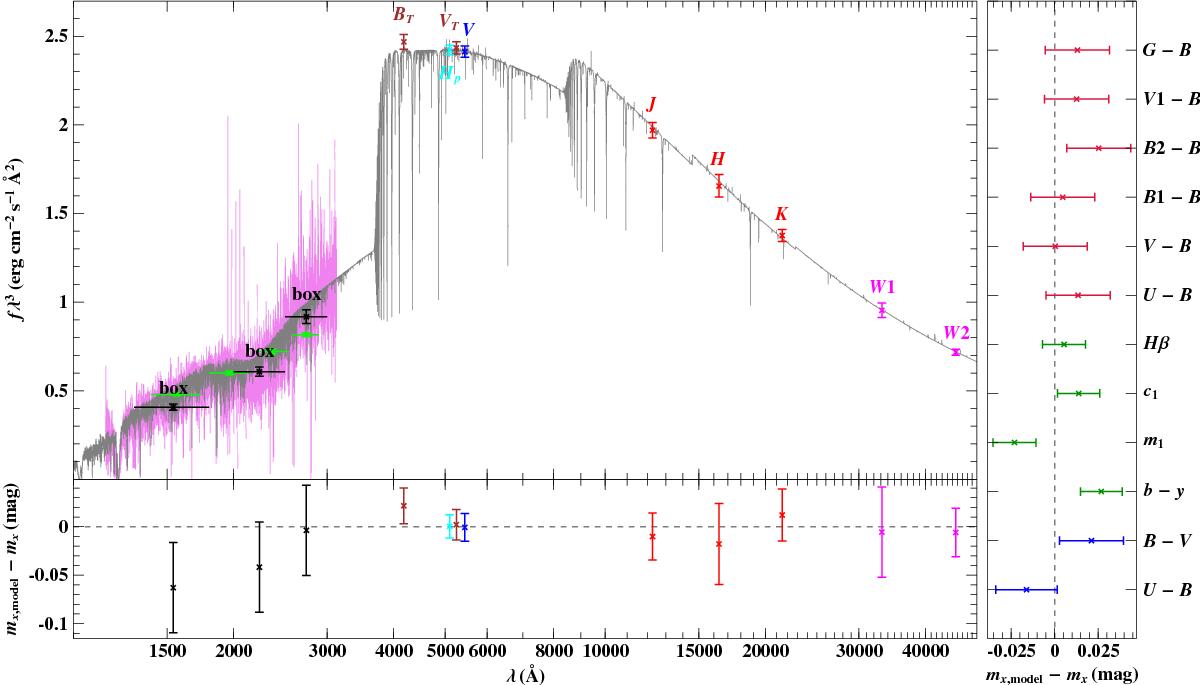
Comparison of best-fitting synthetic and observed photometry: the top panel shows the spectral energy distribution. The colored data points are fluxes converted from observed magnitudes, while the gray solid line represents the best-fitting single-star model. The three black data points labeled “box” are fluxes converted from artificial magnitudes computed by means of box filters of the indicated width from a high-dispersion IUE spectrum (magenta line). The four lime green ultraviolet data points are flux measurements from the TD1 catalog (Thompson et al. 1978) and are shown here for a consistency check. The residual panels at the bottom/side show the differences between synthetic and observed magnitudes/colors. The photometric systems have the following color code: Johnson-Cousins (blue), Strömgren (green), Tycho (brown), Hipparcos (cyan), 2MASS (red), WISE (magenta), Geneva (crimson).
Current usage metrics show cumulative count of Article Views (full-text article views including HTML views, PDF and ePub downloads, according to the available data) and Abstracts Views on Vision4Press platform.
Data correspond to usage on the plateform after 2015. The current usage metrics is available 48-96 hours after online publication and is updated daily on week days.
Initial download of the metrics may take a while.