Fig. A.2
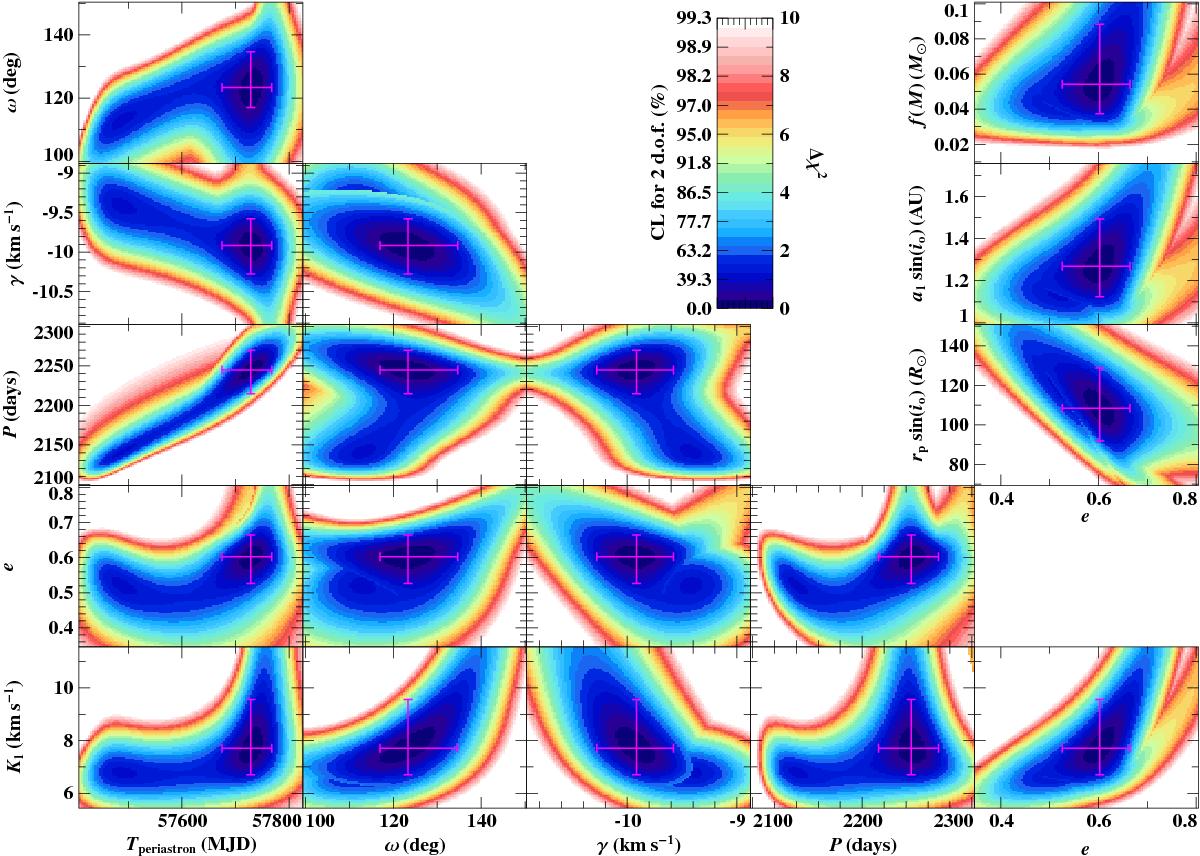
Confidence maps for all combinations of orbital parameters plus eccentricity versus mass function, semimajor axis, and periastron distance: the color codes the χ2 differences Δχ2 with respect to the best fit. The conversion to joint-confidence levels (CL), which are calculated from the Δχ2 values by means of the cumulative distribution function for 2 degrees of freedom (d.o.f.), is shown as well. The magenta error bars indicate single-parameter 1σ-confidence intervals computed from the condition Δχ2 ≤ 1.
Current usage metrics show cumulative count of Article Views (full-text article views including HTML views, PDF and ePub downloads, according to the available data) and Abstracts Views on Vision4Press platform.
Data correspond to usage on the plateform after 2015. The current usage metrics is available 48-96 hours after online publication and is updated daily on week days.
Initial download of the metrics may take a while.