Fig. 4
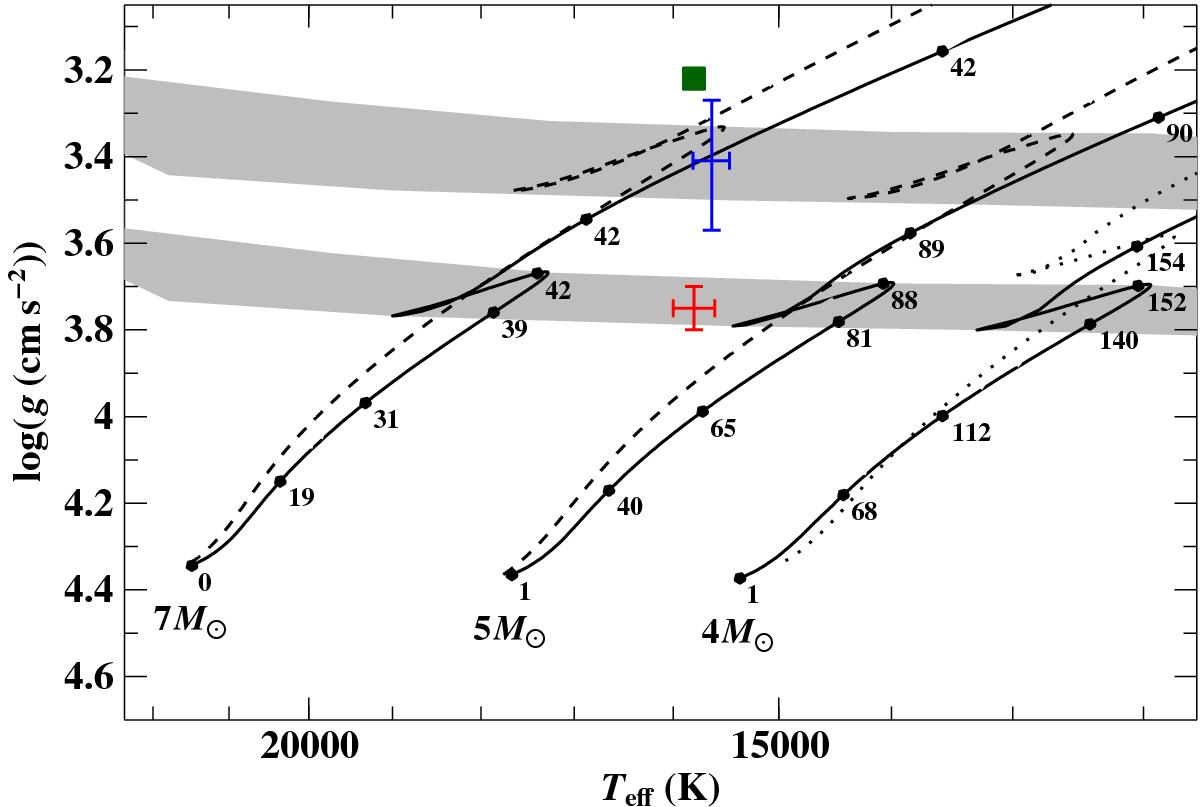
Position of 18 Peg in a (Teff,log (g)) diagram based on spectroscopy (red error bars; Nieva & Przybilla 2012), photometry (blue error bars; this work), and preliminary asteroseismology (green square; this work; Teff taken from spectroscopy). Overlaid are evolutionary tracks for non-rotating stars of solar metallicity and different initial masses by Brott et al. (2011, dashed lines) and Ekström et al. (2012, solid lines). The numbers next to the black filled circles give the evolutionary age in Myr. The gray-shaded areas highlight the transition region between MS and post MS for the two different sets of models. The impact of stellar rotation is demonstrated via the dotted line, which is an Ekström et al. (2012) track for a rotating (Ω / Ωcrit = 0.4) star with an initial mass of 4 M⊙.
Current usage metrics show cumulative count of Article Views (full-text article views including HTML views, PDF and ePub downloads, according to the available data) and Abstracts Views on Vision4Press platform.
Data correspond to usage on the plateform after 2015. The current usage metrics is available 48-96 hours after online publication and is updated daily on week days.
Initial download of the metrics may take a while.