Fig. 3
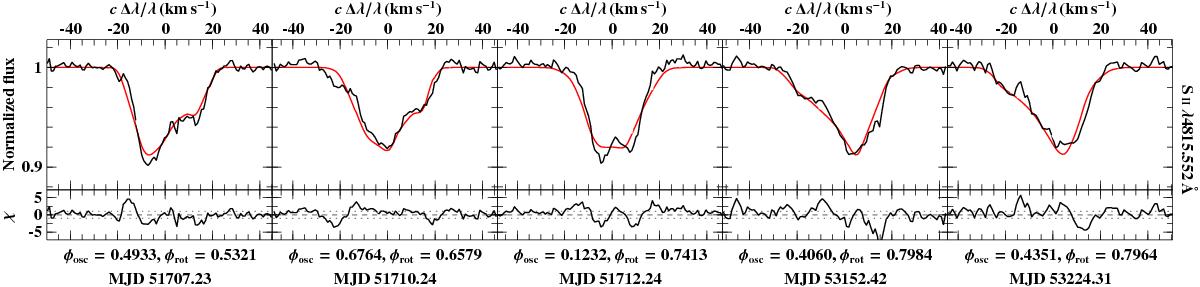
Spectral modeling of the pulsationally driven line-profile distortions for five epochs (columns) and one exemplary line (see Fig. D.2 for more lines): the Uves observations are indicated by a black line, the model (see Appendix D for details) by a red one, and the quality of the fit by the residuals χ. Oscillation and rotation phases are listed on the x-axes.
Current usage metrics show cumulative count of Article Views (full-text article views including HTML views, PDF and ePub downloads, according to the available data) and Abstracts Views on Vision4Press platform.
Data correspond to usage on the plateform after 2015. The current usage metrics is available 48-96 hours after online publication and is updated daily on week days.
Initial download of the metrics may take a while.