Fig. 2
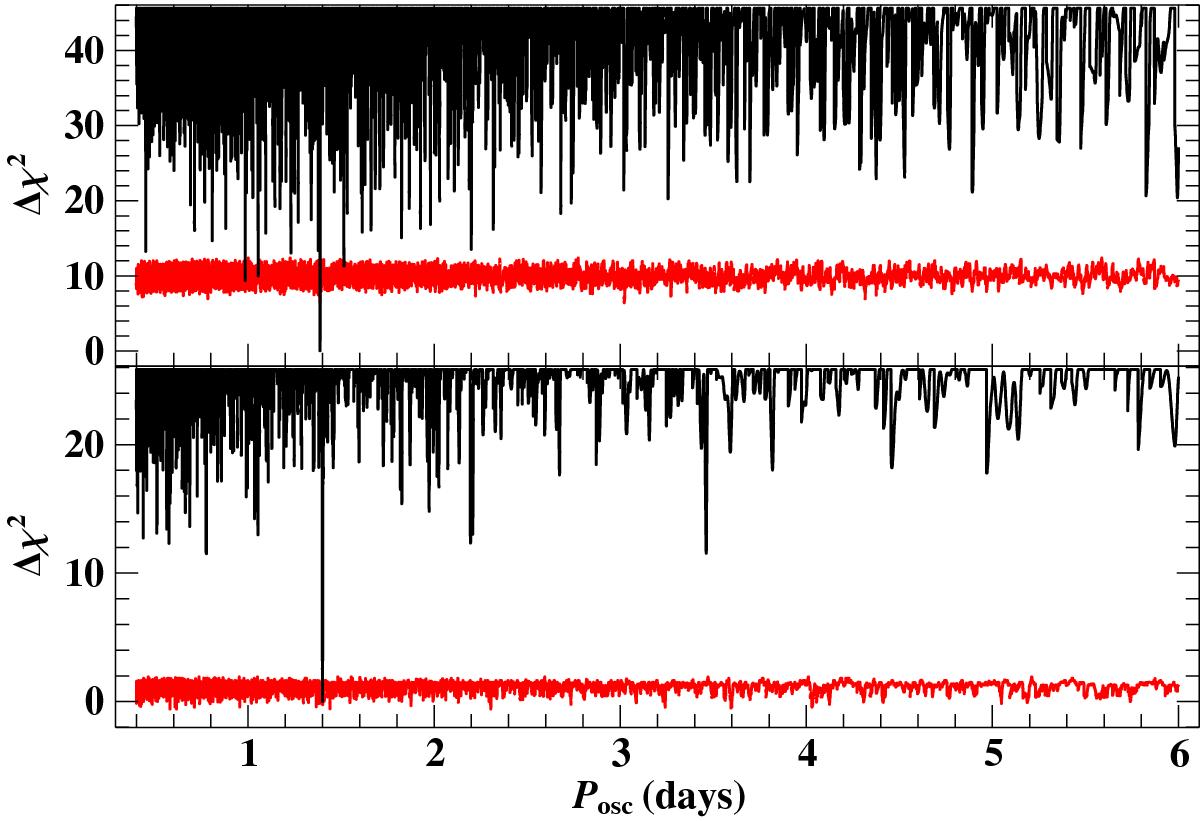
The χ2 landscapes (“periodograms”), which result from fitting the Tycho and Hipparcos epoch photometry data (top) and the ASAS light-curve (bottom) with the model given in Eq. (C.1), as a function of the oscillation period: the differences Δχ2 are with regard to the respective best fit given in Table C.1. A step size of 10 s is used to sample the oscillation period. The red line is the 4% false-alarm probability threshold deduced from Monte Carlo simulations (see Appendix C for details).
Current usage metrics show cumulative count of Article Views (full-text article views including HTML views, PDF and ePub downloads, according to the available data) and Abstracts Views on Vision4Press platform.
Data correspond to usage on the plateform after 2015. The current usage metrics is available 48-96 hours after online publication and is updated daily on week days.
Initial download of the metrics may take a while.