Fig. D.1
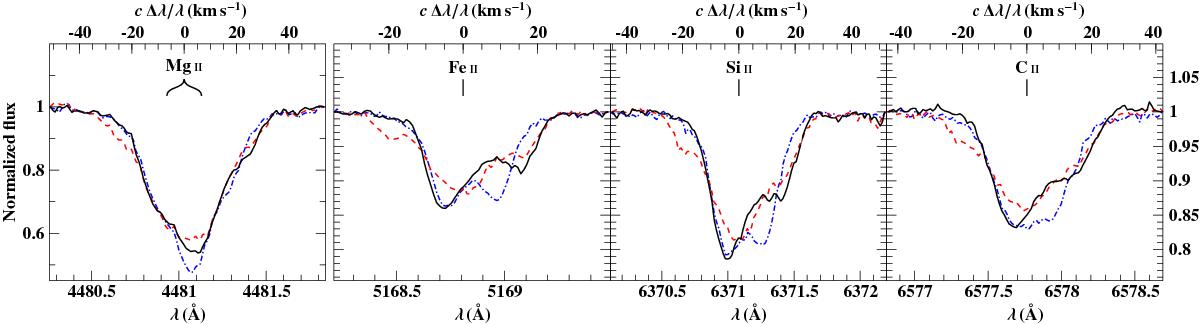
Demonstration of line-profile variations by means of prominent metal lines: the black solid, red dashed, and blue dash-dotted lines are observed Uves spectra with spectral resolutions R = 77 810 (Mg ii) and R = 107 200 (Fe ii, Si ii, and C ii) taken three and two days apart (MJD 51 707.23, 51 710.24, and 51 712.24). All lines – we note that Mg ii is a blend of two lines of similar strength – show the same temporal and morphologic changes, which resemble those of SPB stars.
Current usage metrics show cumulative count of Article Views (full-text article views including HTML views, PDF and ePub downloads, according to the available data) and Abstracts Views on Vision4Press platform.
Data correspond to usage on the plateform after 2015. The current usage metrics is available 48-96 hours after online publication and is updated daily on week days.
Initial download of the metrics may take a while.