| Issue |
A&A
Volume 591, July 2016
|
|
|---|---|---|
| Article Number | A143 | |
| Number of page(s) | 16 | |
| Section | Extragalactic astronomy | |
| DOI | https://doi.org/10.1051/0004-6361/201628743 | |
| Published online | 01 July 2016 | |
Exploring the mass assembly of the early-type disc galaxy NGC 3115 with MUSE⋆
1 IRAP, Institut de Recherche en
Astrophysique et Planétologie, CNRS, 14, avenue Édouard Belin, 31400
Toulouse,
France
2 Université de Toulouse, UPS-OMP,
Toulouse,
France
3 European Southern Observatory,
Karl-Schwarzschild-Str.
2, 85748
Garching,
Germany
e-mail: This email address is being protected from spambots. You need JavaScript enabled to view it.
4 Universite Lyon 1, Observatoire de
Lyon, Centre de Recherche
Astrophysique de Lyon and École Normale Supérieure de Lyon, 9 avenue Charles
André, 69230
Saint-Genis-Laval,
France
5 Leibniz-Institut für Astrophysik
Potsdam (AIP), An der Sternwarte
16, 14482
Potsdam,
Germany
6 Department of Physics and Astronomy,
Macquarie University, Sydney
NSW
2109,
Australia
7 Australian Astronomical Observatory,
PO Box 915,
Sydney
NSW
1670,
Australia
Received:
19
April
2016
Accepted:
7
May
2016
Abstract
We present MUSE integral field spectroscopic data of the S0 galaxy NGC 3115 obtained during the instrument commissioning at the ESO Very Large Telescope (VLT). We analyse the galaxy stellar kinematics and stellar populations and present two-dimensional maps of their associated quantities. We thus illustrate the capacity of MUSE to map extra-galactic sources to large radii in an efficient manner, i.e. ~4 Re, and provide relevant constraints on its mass assembly. We probe the well-known set of substructures of NGC 3115 (nuclear disc, stellar rings, outer kpc-scale stellar disc, and spheroid) and show their individual associated signatures in the MUSE stellar kinematics and stellar populations maps. In particular, we confirm that NGC 3115 has a thin fast-rotating stellar disc embedded in a fast-rotating spheroid, and that these two structures show clear differences in their stellar age and metallicity properties. We emphasise an observed correlation between the radial stellar velocity, V, and the Gauss-Hermite moment, h3, which creates a butterfly shape in the central 15′′ of the h3 map. We further detect the previously reported weak spiral- and ring-like structures, and find evidence that these features can be associated with regions of younger mean stellar ages. We provide tentative evidence for the presence of a bar, although the V-h3 correlation can be reproduced by a simple axisymmetric dynamical model. Finally, we present a reconstruction of the two-dimensional star formation history of NGC 3115 and find that most of its current stellar mass was formed at early epochs (>12 Gyr ago), while star formation continued in the outer (kpc-scale) stellar disc until recently. Since z ~2 and within ~4 Re, we suggest that NGC 3115 has been mainly shaped by secular processes.
Key words: galaxies: elliptical and lenticular, cD / galaxies: evolution / galaxies: formation / galaxies: kinematics and dynamics / galaxies: stellar content / galaxies: structure
The images of the derived parameters in FITS format and the reduced datacube are only available at the CDS via anonymous ftp to cdsarc.u-strasbg.fr (130.79.128.5) or via http://cdsarc.u-strasbg.fr/viz-bin/qcat?J/A+A/591/A143
© ESO, 2016
1. Introduction
Key mechanisms related to galaxy formation and evolution, such as stellar feedback, gas accretion, satellite accretion, and merging, leave their footprints on galaxy morphology, dynamical structures, and stellar components. The cores and the outskirts of galaxies thus both contain crucial information that should help us understand the onset and assembly of galactic systems. Simulations have shown that the above-mentioned physical processes create dramatic changes in a galaxy’s stellar kinematics (e.g. Hoffman et al. 2010; Bois et al. 2011) and stellar population (Hopkins et al. 2009) between their inner and outer regions.
One of the clear predictions from modern galaxy formation scenarios is that the relative contributions and timing of in situ and ex situ star formation should appear as a relative change in the stellar content and structures from the centre to the outer parts of galaxies (Dekel et al. 2009; Zolotov et al. 2009; Naab et al. 2009; Oser et al. 2010; Font et al. 2011; Lackner et al. 2012; Navarro-González et al. 2013; Rodriguez-Gomez et al. 2016). The characteristic radius at which this transition is expected to happen and be detected is still debated. Simulations of gas-rich mergers (Hoffman et al. 2010) show that kinematical transitions should occur between 1 and 3 galactic effective radius (Re), whereas cosmological simulations (Hirschmann et al. 2015), including stellar winds and gas/satellite accretion, found that the transition radius could be pushed outwards between 4 and 8 Re (based on the metallicity gradient). Photometric studies have started to tackle this issue outside the local group (Martínez-Delgado et al. 2010; Forbes et al. 2011; van Dokkum et al. 2014) and recently large surveys (Roediger et al. 2011; Duc et al. 2014) have taken a detailed quantitative look at early-type galaxies revealing prominent stellar streams, tidal-tails, stellar shells, etc., that again emphasise the importance of merging, gas, and satellite accretion in the assembly histories of galaxies. Photometric studies are powerful tools used to study the relics of mass assembly in the low surface brightness outer regions of galaxies, where long dynamical timescales can preserve these signatures up to several gigayears. Spectroscopic studies, however, allow kinematic and stellar population signatures to be determined precisely, and are able to reveal how and when the stellar mass formed over cosmological timescales.
Milestones have been reached via integral field unit (IFU) surveys such as ATLAS3D (Cappellari et al. 2011), which suggests a new classification of early-type galaxies based on their dynamical status, or CALIFA (Sánchez et al. 2012; García-Benito et al. 2015), which systematically covers a diameter-selected sample of nearby galaxies. These surveys provide spatial resolutions often reaching 100 pc or lower, allowing the study of star formation regions, inner stellar and gaseous structures such as circumnuclear discs, and decoupled cores. However, they typically only probe up to one or two effective radii. Other successful surveys like SLUGGS (Brodie et al. 2012, 2014) were designed to probe galaxies to much larger radii. These are time consuming campaigns and often miss either spatial resolution and/or sample size. Challenging surveys like SAMI (Croom et al. 2012; Bryant et al. 2015) or MaNGA (Bundy et al. 2014) are trying to fill that gap with impressive samples of thousands of galaxies, but unfortunately will lack the combined radial coverage and spatial resolution to resolve subkiloparsec structures and large-scale properties simultaneously.
The new IFU, MUSE (Bacon et al. 2010), mounted on the Unit 4 telescope (UT4) at the Very large Telescope (VLT), has been designed to offer a relatively large field of view (1′× 1′ ) with good spatial sampling (0.̋2) and very high throughput, making it a powerful tool for mapping nearby extra-galactic targets to large radii in a reasonable amount of time. Its capacity to perform large mosaics (Weilbacher et al. 2015) as well as its extreme stability, calibration quality, and high sensitivity (Bacon et al. 2015) has already been demonstrated and makes this instrument one of the best existing IFU instruments for the detailed study of stellar and ionised gas properties (kinematics and population) of extra-galactic targets.
NGC 3115 was observed during the first commissioning run of the MUSE spectrograph; the intention was to demonstrate the instrument’s capabilities and test its performance. Thanks to these commissioning data, the strategy of observations, the calibration scheme, and the instrument set-up were developed further in parallel with an updated data reduction pipeline, which dramatically improved the output data quality of the MUSE instrument (Weilbacher 2015). NGC 3115 is the closest S0 galaxy to the Milky Way (d = 9.8 Mpc , Cantiello et al. 2014), with a subsequently large apparent diameter (μB = 25 mag arcsec-2~ 8′). It is bright and almost edge-on (i = 86°, Capaccioli et al. 1987) with very little dust and gas (Li et al. 2011; Li & Wang 2013). It has a smooth surface brightness distribution, making it ideal to test the spectro-imager and mosaicing abilities of MUSE. NGC 3115 is also a very interesting object with a complex set of substructures, including a nuclear disc and an outer (kpc-scale) disc (Capaccioli et al. 1987; Nieto et al. 1991; Scorza & Bender 1995; Lauer et al. 1995; Emsellem et al. 1999), possible rings and spirals (Norris et al. 2006; Michard 2007; Savorgnan & Graham 2016), a rapidly rotating spheroid (Arnold et al. 2011, 2014), a large globular clusters system exhibiting a clear bi-modality (Kuntschner et al. 2002; Brodie et al. 2012; Jennings et al. 2014; Cantiello et al. 2014), a central super-massive black hole (Kormendy & Richstone 1992; Kormendy et al. 1996; Emsellem et al. 1999), and a few X-ray sources (Wong et al. 2011; Wrobel & Nyland 2012).
This paper is organised as follows. In Sect. 2 we present the observations and our data reduction, especially our sky subtraction method. In Sect. 3 we explain our stellar kinematics extraction and analysis, and in Sect. 4, the stellar population and star formation history that we derive. In Sect. 5 we discuss the different substructures of NGC 3115, including the possible existence of a bar, that we use to constrain the formation and evolution scenarios of the galaxy within ~4 Re. We conclude in Sect. 6.
2. The MUSE NGC 3115 data set
2.1. Observations and data reduction
We present here the first IFU observations obtained with MUSE of the early-type S0 galaxy NGC 3115. These observations were obtained during the first instrument commissioning (ESO program 60.A-9100(A)). Before describing the data reduction process itself, it is important to emphasise that the observations were obtained in conditions that were far from optimal in terms of the definition of the observing blocks, the strategy for the sky exposures, the calibration strategy, the sky background (moon illumination), etc. As a consequence, and despite careful data reduction, strong systematics still persist and may bias the analysis. The impact of systematic errors in the data resulting from these non-optimal aspects of the observations are considered in detail in Sects. 2.2, 3.1, and 4.1.
NGC 3115 was observed during the night of 8 February 2014 using MUSE nominal mode (WFM-N) that allows a continuous wavelength coverage from 4750−9300 Å with a varying resolution of R = 2000−4000. These data were designed as a first test of the mosaicing abilities of MUSE using an extended (bright) target that showed substructures and had ample published imaging and spectroscopic data for comparison. Five exposures of only 10 minutes each were obtained, each exposure overlapping its neighbours over a quarter of the field of view (i.e. 30′′× 30′′), with the central exposure centred on the galaxy nucleus. The data obtained cover ~4 Re (Re ~ 35′′, Arnold et al. 2014) along the NGC 3115 major axis (see Fig. 1). One extra exposure of 10 minutes was taken off-target in the middle of the observing block, 4′ away from the target toward the east, in order to estimate the sky level contribution. Neither dithering nor rotations were done between exposures. The data were taken under good weather conditions with a recorded DIMM seeing (full width at half maximum, FWHM) varying between 0.̋7 and 0.̋8.
We used the MUSE reduction pipeline (v1.0, Weilbacher et al. (2012), Weilbacher et al. in prep.) to reduce the data and used the associated standard calibration files (bad pixels, filters list, lines and sky lines catalogue, extinction table, vignetting), except for the “astrometry” and “geometry” solutions, which come from the first commissioning run (since the IFUs have been re-aligned since then). All exposures (on- and off-target) were reduced in the same way as follows: bias subtracted; flat-fielding and illumination corrected, using a twilight exposure; and wavelength calibrated, using master calibration files built from the calibration files closest in time to the target exposures. We checked that the temperature did not vary significantly (less than one or two degrees) in between calibration files and on- and off-target exposures. One standard star was observed at the beginning of the night, GD 71, and was used to flux calibrate the science exposures.
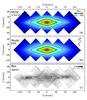 |
Fig. 1 Panel a) MUSE reconstructed V-band image of NGC 3115 obtained through the MUSE pipeline. Panel b) photometric V-band model of NGC 3115 from Emsellem et al. (1999). The model flux is scaled to the MUSE V-band image, which is in arbitrary units. Panel c) normalised residuals of the MUSE reconstructed V-band image obtained by subtracting the Emsellem et al. (1999) model. The overall flatness of the residuals shows the good quality of our data reduction process (see Sect. 2.2). The significant residual structures (inner-disc, spirals, etc.) are discussed in Sect. 5.1. |
2.2. Sky subtraction
The observations were taken with 81% of moon illumination (67 degrees away) during the moon set, leading to a very high sky background level with very strong variations between each on-target exposure. As mentioned above, only one sky exposure was obtained and thus available for the five on-target exposures. To subtract the correct sky level background from each on-target exposure, we developed the following method.
We first sky subtracted each science exposure individually using the direct MUSE pipeline measurement of the sky spectrum from the sky exposure. We then used the overlapping area between each on-target exposure to estimate the relative spectral variation of the sky level from one science exposure to another. We used four areas of 25 × 25 spaxels (i.e. ~5′′× 5′′) on each exposure for this comparison. We obviously made sure beforehand that all exposures were aligned using foreground stars and/or globular clusters. Because the time variations of the sky lines are quite complex, we only estimated the lunar continuum variation by fitting a third-order polynomial to the spectral variation of the continuum. We then scaled the modelled difference accordingly to create a total spectrum of the sky continuum variation (i.e. smoothing the noise added by the subtraction process) between two overlapping on-target exposures. The sky lines are not corrected through this process (i.e. not taken into account by the scaling of the sky level), and we thus mask these lines for further analysis of the spectra.
Since the sky exposure and on-target exposures have the same exposure time, we first applied this method to the two exposures framing the sky exposure itself and added (or subtracted) half of the measured sky continuum variation to the initial estimation. We then performed the sky subtraction of these two exposures via the MUSE pipeline, using the new respective estimation of the sky continuum and letting the pipeline fitting the sky emission lines using the available sky lines list. We then propagated the method described above using the reduced corrected on-target exposures. To validate our sky subtraction method, we compared the obtained spectra in the area used to estimate the sky level variation between two overlapping exposures. There, we measured a mean spectral variation (for the same physical area on-target) of the order of three to five per cent.
We performed the merging of the five exposures through the MUSE pipeline and obtained a fully reduced cube; its associated noise was estimated and propagated through the MUSE pipeline. To confirm once again the good performance of our method, we subtracted a photometric V-band model of NGC 3115 (in Emsellem et al. 1999) from the MUSE reconstructed V-band image (see Fig. 1) and observed flat normalised residuals over the full coverage of the MUSE pointings, i.e. ~5% absolute fluctuation on average. The significant intrinsic residual structures visible in panel c of Fig. 1 (inner disc, spirals, rings, etc. ) are discussed in Sect. 5.1.
2.3. Voronoi binning of the MUSE cube
Prior to any analysis of the data, we spatially binned our reduced MUSE cube to increase and homogenise the signal-to-noise ratio (S/N) of the spectra. We used the adaptive spatial binning software developed by Cappellari & Copin (2003)1 based on Voronoi tessellation. We estimated the original S/N of each individual spectrum by using the variance spectra produced by the MUSE pipeline. We used a median within a relatively narrow spectral window, between 5450 Å and 5550 Å, which is clean of strong sky emission lines, and is representative of the wavelength range we use to extract the stellar kinematics and population properties.
We chose a target S/N of 50 per Å for each spatial bin (spaxels), which offers good data quality to perform a robust stellar kinematics and population extraction (S/N of 40 is usually enough; Cappellari et al. 2011), while keeping reasonable spatial sampling. The adaptive spatial binning delivered more than 60% of the bins with a S/N equal to or greater than 50, a general scatter of ~7, and less than 0.1% of the bins with a S/N lower than 40. Because the central ~40′′× 10′′ originally have a S/N greater than 50, they were kept unbinned.
3. Stellar kinematics analysis
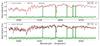 |
Fig. 2 Stellar kinematics fits a) of the central spaxel and b) the lowest S/N spectrum of our MUSE NGC 3115 data cube. The fits were performed with the pPXF software (Cappellari & Emsellem 2004) over the wavelength range 4760−6850 Å and using the MILES stellar library (Sanchez-Blazquez et al. 2006; Falcón-Barroso et al. 2011). The black lines show the MUSE spectra, the red lines the best fits, the shaded green areas the wavelength ranges not fitted (i.e. corresponding to the sky lines regions), and the green crosses the fit residuals (shifted upwards by 0.5 along the y-axis). The top right box in each panel indicates the respective S/N of the MUSE spectrum showed. |
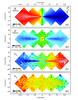 |
Fig. 3 Maps of the first four line-of-sight velocity distribution (LOSVD) moments: a) mean stellar radial velocity, V; b) mean stellar velocity dispersion, σ; c) third-order Gauss-Hermite moment, h3; and d) fourth-order Gauss-Hermite moment, h4. The colour scheme for each panel is indicated in the bottom left corner. The kinematics maps clearly show a thin, kinematically cold, fast-rotating disc embedded in a kinematically hotter, rotating spheroid. We note the correlation between h3 and V in the central 15′′, away from the major axis, suggesting the central bar that we discuss in Sect. 5.2. |
3.1. Stellar kinematics extraction and estimation of the systematic errors
To measure the stellar kinematics of NGC 3115 from the MUSE cube, we used the penalised pixel-fitting method (pPXF) developed by Cappellari & Emsellem (2004). The pPXF method uses a stellar library to build an optimal template that will best fit the observed spectrum using Gauss-Hermite functions. We used the full MILES2 stellar library (Sanchez-Blazquez et al. 2006; Falcón-Barroso et al. 2011) covering the wavelength range 3525−7500 Å with a constant spectral resolution of 2.50 Å FWHM, similar to but lower than the MUSE spectral resolution. Since the difference in spectral resolution between the MUSE data and the MILES stellar library (0.2 Å FWHM at 5000 Å , i.e. σ = 5 km s-1 ) is significantly lower than NGC 3115 velocity dispersion (σ> 70 km s-1), we did not convolve the stellar library to the same spectral resolution as the observed spectra.
We derived the first four order moments of the line-of-sight velocity distribution (LOSVD), namely V, σ, h3, and h4, for each spaxel of the MUSE cube in the following manner. We first selected a collection of templates among the MILES library from the fitting results of a representative MUSE spectrum of NGC 3115. This spectrum was obtained by stacking the spectra within a circular aperture of 5′′ (in radius), centred on the galaxy photometric centre. Then, we used this combination of templates to fit each spaxel of the MUSE data. We set up pPXF to use additive polynomials of the 8th order and the default value of penalisation (0.4). We restricted the wavelength range fitted to 4760−6850 Å to avoid spectral regions highly contaminated by sky lines (λ> 7000 Å), and masked five strong sky emission lines at 5577.4 Å, 5889.9 Å, 6157.5 Å, 6300.3 Å, and 6363.7 Å (see Sect. 2.2). Given the lack of evidence of any dust or gas in NGC 3115, either from the literature or from our MUSE spectra, we did not mask for any potential ionised gas emission lines. Using equation (1) of Sarzi et al. (2006), we estimate our gas emission lines detection limit to an equivalent width of 0.26 Å for Hβ and [OIII]. As an example, two performed fits are presented in Fig. 2, including the central spaxel (with a S/N ~ 90) and the lowest S/N spaxel (S/N ~ 33) of the spatially binned MUSE observations.
To quantify the impact of our fitting parameters on our results, we performed similar analyses but varying one parameter at a time. Firstly, we used additive polynomials of the 4th order, commonly used for fitting spectra on narrower, SAURON-like, wavelength range. Secondly, we masked all the potential emission lines from the galaxy, e.g. Hβ, [OIII], Hα, [NII] and [SII]. Finally, we fitted the MUSE spectra on a restricted wavelength range (5000−5500 Å) that contains the Fe lines and the Mgb triplet, which on their own strongly constrain the derived stellar kinematics. In all cases, we measured similar kinematics structures, with mean differences of only a few kilometers per second for the two first LOSVD moments, V and σ, and mean differences of 0.001 to 0.02 for h3 and h4.
We should emphasise, however, that there are still clear systematic errors mostly regarding the third- and fourth-order moments h3 and h4. The corresponding maps show some odd features, for example a clear offset of the h4 level at the edges of the field (see Figs. 3 and 4). This is not surprising considering the original strong variation of the sky background (see Sect. 2.2), between exposures and also within the field of view of individual exposures (residual gradient). Assuming symmetric (odd or even) moment maps for h3 and h4 (with respect to the photometric minor axis), we estimate these systematic errors to 0.02 for h3 and 0.05 for h4.
3.2. Stellar kinematics results
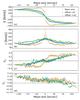 |
Fig. 4 One-dimensional curve of the first four line-of-sight velocity distribution (LOSVD) moments: a) stellar radial velocity, V; b) stellar velocity dispersion, σ; c) third-order Gauss-Hermite moment, h3; d) fourth-order Gauss-Hermite moment, h4. The points were extracted from the two-dimensional maps of the respective quantities (see Fig. 3), by taking the light-weighted mean value within a 2′′ wide slit, aligned with the major axis (orange points), and offset by +8′′ (green points) and +20′′ (blue points) along the minor axis. |
We present in Fig. 3 the stellar kinematics maps of NGC 3115, obtained as described in Sect. 3.1 from our MUSE reduced cube. The mean radial stellar velocity map (Fig. 3, panel a) exhibits a fast-rotating structure, similar to a thin disc, embedded in a slower spheroidal component, but still rotating fairly rapidly. The thin disc structure has an apparent vertical extent (with respect to the major axis) widening from a few arcseconds near the centre to 20′′ (i.e. ~930 pc) at about two effective radii (i.e. ~70′′ or ~3.4 kpc) where it becomes blended with the spheroidal part of the galaxy. The thinness of the kinematic disc also confirms that NGC 3115 is viewed almost edge-on. Along the major axis, the mean radial stellar velocity curve exhibits a double maximum (see Fig. 4, panel a) with a first steep rise to 150 km s-1 within the central 2′′, a first plateau between 2−7′′, and a second maximum at ~9′′ peaking at ~200 km s-1, before rising to the maximum rotation of 280−290 km s-1 at ~20′′ from the centre. At larger radii, the mean radial stellar velocity flattens to 205 km s-1. Further away from the major axis, i.e. just above the equatorial plane, the velocity gradient across the minor axis becomes significantly shallower, representative of the rotation curve of the spheroidal component.
This superposition of a disc-like structure embedded in a rotating spheroid is also beautifully revealed in the velocity dispersion map (Fig. 3, panel b): the lowest velocity dispersion values (~80−90 km s-1) match precisely the spatial extent of the disc, and rapidly increase (up to ~150 km s-1) moving off the major axis, corresponding to where the spheroidal component dominates. We also notice a transition zone between the dynamically cold disc and spheroid where the velocity dispersion values stay ~100−110 km s-1 . The stars associated with this relatively cold and fast-rotating component could be interpreted as a thick disc structure, although it is difficult to identify this just from the kinematics itself. In the centre of the galaxy, the velocity dispersion peaks at 321 km s-1 (based on individual spaxels) that is very probably partly the sign of a central dark mass (Kormendy & Richstone 1992; Kormendy et al. 1996; Emsellem et al. 1999). We also notice that the velocity dispersion within the central 15′′ is higher than in the disc component, whereas the disc-like structure goes all the way to the centre in the velocity map (Fig. 4, panel a). It is known from photometry that NGC 3115 has a nuclear disc (Lauer et al. 1995; Kormendy et al. 1996) of ~3′′ in radius and an inner ring (Savorgnan & Graham 2016) of ~15′′ (see also Sect. 5.1). What we see in the σ map is therefore the superposition along the line of sight (LOS) of four or five kinematic components that results in an increase of the velocity dispersion (each component having a different rotational speed): the nuclear-disc, the inner-ring, the thin disc, a possible a thick disc, and the spheroid. At large radii, i.e. greater than 80′′, slightly larger than two effective radii, all these kinematic structures fade into one single rotating structure as the V and σ maps flatten uniformly. We can therefore constrain the apparent radial extent of the thin stellar disc to ~80′′ (i.e. ~3.8 kpc). This outer structure forms a smooth and continuous extension of the spheroidal component that dominates off the equatorial plane (~20′′) at all radii.
Figure 3 (panel c) shows the h3 map of NGC 3115, the third Gauss-Hermite moment. The h3 moment represents the skewness of the LOSVD. A positive (negative) h3 value means that the LOSVD skew towards lower (higher) velocities with respect to the mean (van der Marel & Franx 1993; Gerhard 1993). Over most of the covered field of view, the NGC 3115 h3 moment is anti-correlated with respect to its stellar radial velocity, V. This V-h3 anti-correlation is commonly observed (see Bender et al. 1994; Krajnović et al. 2008, and references therein) and is expected from fast-rotating disc-like structures embedded within a slower rotating, more spheroidal stellar component, as in NGC 3115. Figure 4 (panel c) shows that h3 exhibits a small turn-over at a radius of ~2′′ and a plateau at ~15′′ along the major axis that coincides perfectly with the slope changes of the radial stellar velocity, V. More interestingly, we observe a reversal of sign in the h3 moment map, creating a butterfly shape in its central 15′′, away from the thin fast-rotating disc, and up to ~10′′ above the major axis. This region of correlated V and h3 may be due the LOS intercepting both the spheroidal component, which dominates the light, and the edges of the fast-rotating outer disc, creating a high-velocity wing in the LOSVD. Such a correlation is also often generically explained by the orbital structure associated with the combination of a bar (Athanassoula & Bureau 1999; Chung & Bureau 2004) and an inner-disc, a possibility which may be supported by the double maximum observed in the NGC 3115 rotation curve. The origin of this butterfly region in the h3 moment map is discussed further in Sect. 5.2.
Figure 3 (panel d) shows the h4 map of NGC 3115, the fourth Gauss-Hermite moment. The h4 moment represents the kurtosis of the LOSVD. A positive (negative) h4 value means that the LOSVD shows a narrower (broader) symmetric profile than a pure Gaussian LOSVD (van der Marel & Franx 1993; Gerhard 1993; Bender et al. 1994). The h4 values of NGC 3115 are uniform with positive values of ~0.05, and slightly lower values along the major axis in the inner 15′′. We also note higher h4 values along the minor axis associated with the cone-like structure observed in the dispersion map (with high σ values), and also along the thin stellar disc. Finally, it is important to mention that the shallow gradient we observe in the h4 moment map, from the left to the right side, can likely be associated with the systematic errors noticed in Sect. 3.1. These systematics are also visible in panel d of Fig. 4.
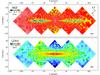 |
Fig. 5 Maps of the stellar population of NGC 3115 obtained through regularised full spectral fitting: a) mass weighted age; and b) mass weighted metallicity, [Z/H]. The colour code for each panel is indicated on its top left corner. We observe a clear distinction of age between the disc and the spheroid component of NGC 3115, as well as a clear metallicity gradient along the major and minor axis of the stellar disc. |
Our results are consistent with the study by Norris et al. (2006), who already suggested the presence of a fast-rotating, kinematically cold stellar disc component embedded in a slower rotating, kinematically hot spheroid; and Arnold et al. (2011, 2014), which complements our MUSE study with data extending from 4−10 Re. The MUSE data set only reaches about four effective radii, but with obviously much better spatial resolution than any previous study, which is crucial and reveals the full complexity of its kinematic structures.
4. Stellar population analysis
4.1. Age and metallicity measurements
To measure the mean stellar age and metallicity of NGC 3115, we used single stellar populations (SSP) models from the commonly used MIUSCAT library (Vazdekis et al. 2012), which we have previous experience with (Guérou et al. 2015). This library provides single-age, single-metallicity stellar population models theoretically computed from the MILES and CaT (Cenarro et al. 2001) empirical spectra3. We used a subset of 120 models covering an age range of 0.5 to 14.1 Gyr (split into thirty bins) and a metallicity range of −0.71 to +0.22 dex (split into four bins), logarithmically sampled and computed using a unimodal IMF with a slope of 1.3, equivalent to a Salpeter (1955) IMF, and based on Padova isochrones (Girardi et al. 2000). These models are included in the “SAFE” range of the MIUSCAT models (see Vazdekis et al. 2012, for more details). The model spectra were retrieved from the MILES website4 and sampled at a spectral resolution of 2.51 Å FWHM.
Although Norris et al. (2006) noticed a significant difference in [α/ Fe] abundance between the major and minor axes of NGC 3115, we restricted our analysis to use only solar abundance models. While spectral models with variable alpha element abundance ratios are currently available (Conroy et al. 2009; Vazdekis et al. 2015), and classic absorption line indices can also be used to infer abundance ratios via models (Thomas et al. 1999; Maraston 2005; Schiavon 2007), the systematic errors remaining in our data due to non-optimal sky subtraction and observing procedures impede the robust extraction of this higher-order information. We have verified, however, that the star formation timescales implied by our star formation histories are consistent with the abundance ratios measured via absorption line indices and single stellar population models, finding that the disc has lower [α/ Fe] than the spheroidal component (in agreement with Norris et al. 2006).
We used this set of models to fit the NGC 3115 spectra, again using the pPXF software and following the same methodology as the kinematics analysis (i.e. the same spatial binning, fits performed over the same spectral range, masking of the sky lines, not masking potential galaxy emission lines). However, as recommended by Cappellari & Emsellem (2004), we used only multiplicative polynomials (of the 16th order) to account for flux calibration errors, not additive polynomials (which can alter the line strengths and bias the age and metallicity inferred). We applied linear regularisation constraints (Press et al. 1992) to the fit via the REGUL keyword in pPXF. As in McDermid et al. (2015) and Guérou et al. (2015), we increased the regularisation until the fit to the spectrum became unacceptable, defined as when the χ2 value exceeds that of the unregularised fit by  , where N is the number of pixels. In this way, we find the smoothest distribution of ages and metallicites that is still statistically consistent with the data. We used the spaxel with the highest S/N to fix the degree of regularisation and subsequently kept it constant over the full field.
The quoted age and metallicity values were derived by taking the mean age and metallicity of the templates forming the best fit, weighted by their contribution to it. Each model of the MIUSCAT library was normalised to a star of one solar mass, hence, the quoted age and metallicity values are mass-weighted. Therefore, the weights distribution obtained with pPXF is also the mass distribution of the total stellar mass, projected onto the grid of models, i.e. the mass per (Age, [Z/H]) combination of each model.
We performed similar analyses with different pPXF settings: masking the potential galaxy emission lines and restricting the fitted wavelength range to 5000–5500 Å, and always recovered the same general structures, both for the age and metallicity maps. We estimate the impact of our fitting parameters to create median absolute differences of ~0.4 Gyr and ~0.05 dex in the determination of the stellar population parameters. Once again, on top of the fitting method, the sky background residuals create systematic errors that are visible in our stellar population maps (i.e. the shallow gradient from left to right on the age map, Fig. 5). Assuming symmetric stellar populations, we estimate the age and metallicity systematic errors to be, respectively, 0.5 Gyr and 0.02 dex.
4.2. Mass-weighted age and metallicity maps from regularised spectral fitting
Figure 5 shows the mass-weighted age (panel a) and metallicity maps (panel b) obtained from our MUSE reduced cube of NGC 3115. The first striking result is the clear age distinction between the two main components of NGC 3115, namely the thin fast-rotating disc and the spheroidal structure. We find an age span of 9–13 Gyr for the stars presumably associated with the thin disc, whereas the stars of the spheroid have a uniform age of 13–13.5 Gyr. The distribution of the younger stars nicely corresponds to the kinematically cold structure observed in the kinematics (Fig. 3, panel b), having a radial extent along the major axis of ~80′′ and a vertical extent of a few arcseconds at 10′′ from the centre to ~15′′ at 60−70′′ along the major axis (Fig. 5, panel a). Also noticeable are the central 10′′ dominated by very old stars, showing a clear positive gradient toward the centre, going from 12.5 Gyr and peaking at 13.5 Gyr. The association of the younger stellar population (9–13 Gyr) with the prominent fast-rotating disc component is demonstrated in Fig. 6, where we plot the stellar age distribution of each MUSE spaxel as a function of the local (spaxel-based) V/σ, the ratio of the stellar mean radial velocity, and velocity dispersion. The spaxels corresponding to the fast-rotating disc (|V/σ| > 1) have younger stellar ages (9–13 Gyr), whereas the pressure supported regions of NGC 3115 (|V/σ| < 1) show an almost uniform and old stellar age distribution (≥13 Gyr). The absolute ages of stellar population models are somewhat uncertain; however, we note that the relative ages between models are more robust (Vazdekis 1999), meaning that the 2−3 Gyr decrease in the mass-weighted mean age of the disc is secure.
Regarding the stellar metallicity, Fig. 5 (panel b) shows that the disc component exhibits a significant gradient along its major axis, having a metal-rich core of ~+0.2 dex and a low metallicity at its extremity (~−0.1 dex at 80′′). The gradient is quite strong in the central region, dropping from +0.2 dex at the centre to +0.1 dex at 10′′ , and even shallower at larger radii. NGC 3115 also shows a strong negative metallicity gradient along its minor axis, from +0.2 dex at its centre to ~−0.2 dex at 20′′. At very large radii, the spheroid component shows a uniform metallicity distribution of ~−0.15 dex. Other interesting features are visible in the metallicity map of NGC 3115, such as a significantly lower metallicity of the spheroid component along the minor axis (down to ~−0.25 dex) and flaring structures (with higher metallicity values of ~−0.05 dex) at ~40′′ along the major axis. Unfortunately, it is hard to interpret these structures since they seem to correspond spatially to the different MUSE exposures. They could be due to real differences in NGC 3115 stellar populations or, alternatively, they could be artefacts of our treatment of the sky variation. However, we can confirm that the stellar spheroid (flattened) is made of significantly more metal-poor stars than the disc component, the latter also showing strong gradients along both its radial and vertical extent.
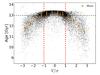 |
Fig. 6 Stellar age (mass-weighted) versus V/σ, the ratio of the stellar radial velocity and velocity dispersion, for each spaxel of NGC 3115 MUSE cube. The spaxels corresponding to the fast-rotating disc (|V/σ| > 1) have younger stellar ages (9–13 Gyr) whereas the pressure supported regions of NGC 3115 (|V/σ| < 1) show a rather uniform and old stellar age distribution (≥13 Gyr). The younger stellar population observed in Fig. 5 is therefore well associated to the fast-rotating disc observed in Fig. 3. To help reading the figure, we indicate the age of 13 Gyr by an horizontal dashed line, and plot the mean and standard deviation of the points distribution in ten bins of V/σ. |
While these results are in agreement with and confirm what has been inferred by Norris et al. (2006), the MUSE data allow us to unambiguously distinguish the different stellar population parameters of the spheroidal and disc of NGC 3115.
4.3. Star formation history and mass assembly of NGC 3115
We used our stellar population analysis to look further at the star formation history of NGC 3115. As explained in Sect. 4.1, the weight distribution obtained with pPXF is the mass distribution of the total stellar mass of the galaxy, i.e. the mass per (Age, [Z/H]) combination of each model. We can thus reconstruct a two-dimensional spatial view of the star formation history of the galaxy by taking the weighting distribution of the stellar models forming the best fit in each spaxel of the IFU observations.
Here we present two ways of looking at this reconstructed star formation history: first, by showing the mass fraction (compared to the present day total stellar mass) of each stellar model (grouped in bins by age and/or metallicity) and second, by reconstructing the total stellar mass of the galaxy in different bins of age. We note that these maps do not reconstruct the mass assembly history of the galaxy at face value, but rather show the present day stellar mass distribution (model dependent) as a function of its mass-weighted age and/or metallicity assuming a smooth star formation history. Nonetheless, these maps can help constrain scenarios for the formation and evolution of NGC 3115.
Figures 7 and 8 show the stellar mass fraction and stellar mass, respectively, in six age bins: 0−4 Gyr, 4−6 Gyr, and up to 14 Gyr in bins of 2 Gyr. From Fig. 8, we derive a total stellar mass of 1.1 × 10¹¹M⊙ for NGC 3115 within the field of view covered by MUSE and consistent with previous estimates (Karachentsev & Kudrya 2014). Most of this stellar mass (~95%, i.e. 1.05 × 10¹¹M⊙,) is made of old stars (>10 Gyr), according to panels (e, f) of Figs. 7 and 8. This old stellar population represents the entire stellar content of the spheroid component, with ~85% of its associated stellar mass formed very early at redshift z ~ 3 and greater (12−14 Gyr ago), and the remaining ~15% formed soon after (10−12 Gyr ago). The central region (~10′′) is also made only of old stars (older than 10 Gyr), which suggests a lack of significant (by mass) gas infall, followed by star formation during the past 10 Gyr at the very centre of NGC 3115. From a more general perspective, Fig. 8 (panel e) shows a more flattened mass distribution for the stellar population with ages between 10 and 12 Gyr, than the oldest stellar population (12−14 Gyr). This suggests that dissipation may have played an important role in the formation and assembly of the central region of NGC 3115 at an early epoch (>12 Gyr, i.e. z ≳ 3). In contrast, the outer stellar disc component has only ~50% of its total stellar mass formed between 12−14 Gy, and ~20% between 10−12 Gyr.
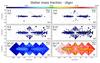 |
Fig. 7 Stellar mass fraction maps of NGC 3115 in six age bins, obtained by projecting the stellar model weighting distribution solution, obtained with pPXF, onto the grid parameters (Age, [Z/H]). For each panel, the age bin limits are indicated in the top left corner, the mean stellar mass fraction in the top right corner, and the colour scheme by the colour bar at the top of the figure. Spaxels containing a stellar mass fraction lower than 0.03 are masked and are considered below our uncertainties. The galaxy orientation is similar to Fig. 3. The extended star formation history of the outer disc component is clearly visible in the first four panels (a) to d)), whereas the stars present in the spheroid were formed early (age ≥ 10 Gyr), with more than 85% of its stellar mass formed between 12−14 Gyr (panels e) and f)). |
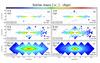 |
Fig. 8 Stellar mass maps of NGC 3115 in six age bins, as in Fig. 7. These maps show the present day stellar mass distribution as a function of its mass-weighted age. For each panel, the total stellar mass per age bin (in solar mass) is indicated in the bottom right corner and the colour scheme limits (corresponding to the colour bar at the top) are in the bottom left corner, and differ from each another. The noticeable change in the shape of the iso-mass contours between 10−12 Gyr and 12−14 Gyr, from rather flat to more spheroidal, suggests a more dissipative mass assembly at early epoch (age > 12 Gyr) possibly from a major merger. Panels a) to c) suggest that extended star formation occurred in situ in the disc component of NGC 3115. |
The first four panels of Fig. 7 and Fig. 8, namely a−d, clearly show that star formation has persisted in the outer stellar disc between z ~ 2 and the present day, whereas the spheroid component and the central regions (~10′′) do not contain stars younger than 10 Gyr. Between ~20−30% (5.7−8.4 × 10⁸M⊙) of the total outer disc stellar mass was formed between 0−10 Gyr with a uniform distribution in each age bin (~5−7%), as shown in Fig. 7. From Fig. 8 we derive a mean star formation rate (SFR) in the disc of NGC 3115 of 0.4 M⊙yr-1 between 10−6 Gyr, decreasing to 0.2 and 0.08 M⊙yr-1 between 6−4 Gyr and 4−0 Gyr, respectively. This suggests that no major mergers have occurred over the last 10 Gyr (as mentioned by Norris et al. 2006) as this would certainly have destroyed such a well-defined stellar disc and disrupted such a steadily decreasing star formation rate.
Figure 9 shows the stellar mass fraction in four metallicity bins (−0.7 dex, −0.4 dex, 0.0 dex, and + 0.22 dex) where we see again the clear distinction between the stellar disc of NGC 3115 and its spheroid component. Between ~40% and 80% of the disc is composed of metal-rich stars (panel d), ~20% have solar metallicity (panel c), and less than ~10% of its stellar mass is found to be metal-poor (panels a, b), with no contribution at all of the most metal-poor bin (−0.7 dex) to the inner 40′′of the disc. In contrast, the spheroid component has a uniform and similar distribution in the four metallicity bins (within our uncertainties), each one containing ~20−30% of its total stellar mass. This is very interesting as it tells us that the spheroid component has (on average) solar metallicity and lower, but still contains a significant fraction of metal-rich stars. It is also interesting to note that the central part of NGC 3115 (including the inner disc) and up to ~40′′ along the major axis, is only made of metal-rich stars, i.e. we do not detect a significant metal-poor component, naturally leading to the observed increasing gradient in the central 10′′ (see Sect. 4.2). This steep gradient suggests that the star formation of the disc components happened in situ (Kobayashi 2004; Pipino et al. 2010), in agreement with their extended star formation histories.
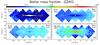 |
Fig. 9 Stellar mass fraction maps of NGC 3115, in four bins of metallicity, marginalised over age. For each panel, the metallicity bin limits are indicated on its top left corner, the mean stellar mass fraction on its top right corner, and the colour scheme by the colour bar at the top of the figure. Spaxels containing a stellar mass fraction lower than 0.03 are masked, considered below our uncertainties. The galaxy orientation is the same as Fig. 3. It is remarkable that the central 10′′ where the inner disc resides, are made of only metal-rich stars (panel d)). The disc component has very little metal-poor stars (panels a) and b)), and the spheroid of NGC 3115 has a flat distribution over the four metallicity bins, from metal-rich to metal-poor. |
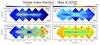 |
Fig. 10 Stellar mass fraction of NGC 3115 in four bins of age/metallicity pairs: young (age ≲ 12 Gyr), old (age > 12 Gyr), metal-rich ([Z/H] = 0.2 dex), and metal-poor ([Z/H] < 0.2 dex). For each panel, the age and metallicity bin limits are indicated in the top left corner, the mean stellar mass fraction in the top right corner, and the colour scheme by the colour bar at the top of its respective column. The old and metal-poor stellar population of NGC 3115 is mostly located in its spheroid component, whereas the young and metal-rich stars are mostly in the disc component. |
Finally, we also analyse the stellar mass fraction distribution of NGC 3115 as a function of the combined stellar age and metallicity (Fig. 10) for four pairs of age/metallicity bins. These four bins were selected based in Figs. 7 and 8 to optimise the separation of the disc and spheroid components. We chose to split the stellar populations with “young” and “old” ages (≲12 Gyr, and >12 Gyr, respectively), and with “metal-rich” and “metal-poor” components ([Z/H] = 0.2 dex, and [Z/H] ≲ 0.2 dex, respectively). Panels b−d illustrate well that the central regions and the spheroid of NGC 3115 are mostly made of old stars: metal-rich in the core of the galaxy and metal-poor ([Z/H] < +0.2 dex) in the spheroid. The outer disc is made of (on average) ~50% of old stellar population, uniformly distributed between the metal-rich and metal-poor bins. Regarding the young stellar population (panels a−c), most of its mass is distributed in the stellar disc, but in a different manner between the metal-rich and metal-poor stars. The metal-rich ([Z/H] = 0.2 dex) young stellar population is present all along the stellar disc, from its extremity (at ~80′′) to the core of NGC 3115 (~5′′ from the centre) and has a rather thin and uniform vertical extent (~5−10′′). On the other hand, the metal-poor ([Z/H] < 0.2 dex), young stellar population has a thicker vertical extent (~20′′) and is located on the external part of the outer disc, i.e. between 20′′ and 80′′ along the major axis of NGC 3115. It would be tempting to associate this distinction in stellar population with the observed kinematics that suggest a thicker disc component (see Sect. 3.2), but this is beyond what we can confirm with the present analysis.
Through these analyses of star formation history and mass assembly we provide a striking illustration of the potential of MUSE spectroscopic data to reveal exquisite details of the stellar population distribution. The formation and evolution scenarios of the different components of NGC 3115 are discussed further in the following Sect. 5.
5. Discussion
5.1. NGC 3115, an S0 galaxy with discs, spirals, and rings
Based on photometry alone, NGC 3115 is classified as an S0 galaxy. Its flattened spheroid component dominates the light, even though the outer and inner discs are very prominent owing to the near edge-on inclination. Going beyond this simple description, NGC 3115 has many substructures that deserve to be discussed. Figure 11 shows the high-resolution photometric residuals (panel a) of NGC 3115 obtained by subtracting the photometric model (Emsellem et al. 1999) from an ACS/HST F475W image (PI IRWIN, ID-12759). Clear signatures of spiral- or ring-like structures are detected in this residual image, confirming what we observed using the reconstructed MUSE V-band image (see Fig. 1, panel c). In the outer part (R>Re), three main features are identified on each side of the galaxy, with characteristic radii of ~40′′, ~60′′, and ~75′′ from the galaxy centre. We can rule out that these structures are model dependent artifacts from the model subtraction as they appear in both the unsharp-masked and model-subtracted images (see panel b of Fig. 11).
In the central region, this unsharp masking technique also beautifully emphasises the presence of the very thin (less than ~0 in height) nuclear-disc of 3′′ in radius (see Fig. 11, panel c), first detected by Lauer et al. (1995) and Kormendy et al. (1996). This nuclear disc spatially matches the steep gradient observed in the central 3′′ of the NGC 3115 rotation curve and in the inner h3 rise (see Fig. 4, panels a and c). Additionally, we observe two anti-symmetric substructures at a radius of ~10′′ and extending down to 4′′. As already suggested by Emsellem (2002), these structures (partially hidden by the bright nucleus) might extend, respectively, above and below the nuclear disc to connect on its opposite edges, thus interpreted as two inner spiral-arms (see Fig. 2 of Emsellem 2002). Further away, at ~15–20′′ the residuals suggest a pair of (inner) spiral-arms or rings, also possibly associated with the corresponding plateau in the stellar velocity profile and the abrupt changes in the velocity dispersion, h3, and h4 profiles. Although these structures are again present in the HST residual image, it is hard to strictly define their nature and exact (deprojected) morphology. The presence of a nuclear ring in NGC 3115 has already been reported by Savorgnan & Graham (2016) and quotes a radial extent of 15′′ for this component.
The existence of the outer spiral-like features has already been suggested by several authors in the literature (Capaccioli et al. 1987; Norris et al. 2006; Michard 2007), always from a photometric point of view. Here, we report for the first time their detection based on the stellar populations derived from spectroscopy. In Fig. 12, we mark the spiral-like structure using contours from the HST residual image on top of the smoothed mean stellar age map of NGC 3115. Remarkably, the photometric spiral-like features roughly match the younger part of what we have so far interpreted as a smooth stellar disc. The inter-arm regions show, on average, stars that are older than the presumed spiral-arms, something that is observed on both sides of the galaxy. We emphasise here that the age difference seen between the spiral-like structures and the inter-arms may simply be due to the contrast between these two regions: the spiral-arms are mass overdensities relative to the inter-arm regions. If the stars in the disc are younger overall, this increases the contrast with the presumed older background and foreground stars, hence the younger mass-weighted age. In other words, what we detect here are primarily mass overdensities and not necessarily local age variations in the disc itself. In the inner region, we do not detect any specific features associated with the presumed inner spiral-arms. This is no proof of a homogeneous stellar population, as actual stellar population differences of such low-contrast and high spatial frequency features are inevitably strongly diluted relative to the dominant metal-rich, older central stellar components of NGC 3115. Looking at possible signatures of the outer overdensities in the individual age bins in Fig. 7, we do detect significant increases in the mass fraction of young stars (for ages from 0 to 10 Gr) specifically between 15′′ and 20′′. There are also small peaks near 40′′ and 60′′ although they are only marginally detected. Interestingly, the increase near a radius of 40′′ is shifted away from the major axis following the anti-symmetric features observed in Fig. 11.
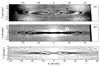 |
Fig. 11 a) ACS/HST residuals after removal of the MGE photometric model (Emsellem et al. 1999); b) unsharp masking of the HST image; c) zoom corresponding to the dashed rectangle of the unsharp masking image (panel b). |
One open question that still persists is about the formation time and development of such spiral structures in NGC 3115. The age distribution observed in Fig. 12 only indicates the mean (mass-weighted) stellar age of the population forming these structures. At a radius of 50′′ (~2.5 kpc), the timescale for a circular orbit is about 60 Myr. It is thus unlikely that the observed spiral-like structures have been frozen (evolution free) over the last ~9−10 Gyr as spiral structures have typical lifetimes of two to three orbital revolutions (Sellwood 2010). Still, such density waves may persist (and evolve) in a non-self-gravitating disc, as long as the wave can propagate and the system does not get too dynamically hot, favoured by the presence of gas (see Bekki et al. 2002). However, we cannot distinguish that scenario from one where the spirals have recently developed out of the – generally younger – disc material. Such density waves could also be imposed via coupling to a tumbling bar, the presence of which we briefly discuss in the following Sect. 5.2.
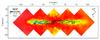 |
Fig. 12 Smoothed version of the stellar age map of NGC 3115; the ACS/HST residual contours are over-plotted. We plot only the zero-level contours corresponding to the potential spiral-arms in order to lighten their boundaries. A clear spatial match is observed between the spiral-like residual structures and the youngest stellar population observed. |
5.2. Signs of a bar in NGC 3115
In addition to the complex structures discussed in Sect. 5.1, in the stellar kinematics there are signatures that can be associated with the presence of a bar in the central region of NGC 3115. Athanassoula & Bureau (1999) performed simulations of peanut-bulge dominated galaxies and concluded that in galaxies seen edge-on, strong bars may show up as (i) a double maximum in the stellar rotation profile along the major axis; (ii) a flat central stellar velocity dispersion profile (sometimes with a dip); (iii) an h3 Gauss-Hermite moment correlated with the stellar radial velocity, V, over the bar length; and (iv) a h3 Gauss-Hermite moment anti-correlated with V in the very centre where nuclear-discs are often present. Such signatures have been observed by Chung & Bureau (2004) in edge-on, bulge dominated spiral galaxies, and more recently, Iannuzzi & Athanassoula (2015) have discussed the dependence on inclination, strength of the bar/peanut components, and outlined features that can be observed with integral-field spectroscopy.
Except for the flat central velocity dispersion (point ii), we observe all signatures mentioned above in NGC 3115. The most striking signature is shown in Fig. 13, where we plot the third Gauss-Hermite moment of the LOSVD, h3, as a function of the local ratio V/σ for each spaxel of the covered MUSE field of view. A strong anti-correlation is visible for |V/σ| ≳ 1, whereas h3 is mostly correlated with V/σ for |V/σ| ≲ 1. More interestingly, we also plot the spaxels corresponding spatially to the nuclear-disc of NGC 3115 (Fig. 13, blue dots) and observe a strong anti-correlation, in agreement with the simulation predictions (point iv). The bar orientation, if seen almost end-on, or the presence of a central dark mass may be partly the reason why we do not observe a flat velocity dispersion profile in NGC 3115.
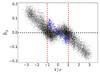 |
Fig. 13 Third Gauss-hermite moment, h3, versus V/σ for each spaxel of NGC 3115 MUSE cube. Blue dots represent the spaxels corresponding to the nuclear-disc (central 3′′ × 1′′) of NGC 3115. |
To further constrain whether a bar could be responsible for such kinematic signatures, we built a simple dynamical axisymmetric model and compared the obtained LOSVD to the one observed with MUSE. This model is based on the multi-Gaussian expansion (MGE) formalism (Emsellem et al. 1994) and follows the procedure as sketched in Emsellem (2013). The MGE model is used to obtain the three-dimensional light distribution; combined with mass-to-light ratios (M/L) and the use of a dark matter halo as in Cappellari et al. (2015), it leads to an analytic description of the three-dimensional mass distribution of the galaxy. The M/L of each Gaussian was chosen as roughly constant and consistent with the published model of Emsellem et al. (1999). We implemented some typical variations of the order of 20% with a slight decrease in the M/L for the younger disc components, as revealed by the age map, and a higher M/L for the most outer regions, following the outer V2 + σ2 map. We note that the choice of these individual M/L is highly degenerate and was not meant to exactly fit the details of the observed kinematics. A full-fledged fitting algorithm would be needed to truly optimise the combination of the anisotropy, dark matter and M/L parameters, but this is clearly beyond the reach of the present paper. We make a realisation of that model using particles, fully consistent with the given mass distribution, and solve the Jeans equations in cylindrical coordinates assuming individual anisotropy parameters for each Gaussian (see also Cappellari 2008), thus fixing the components of the dispersion tensor (σR, σθ, σz). The resulting N-body model is further projected using an inclination angle of 84.5°, and LOSVDs are reconstructed on a spatial two-dimensional grid within the field covered by the MUSE pointings. These LOSVDs are finally fitted individually with Gauss-Hermite functions, providing an individual measurement for each point of the grid of the mean radial velocity V, velocity dispersion σ, and higher-order Gauss-Hermite moments, h3 and h4 (as in e.g. Emsellem 2013).
We have tuned the anisotropy parameters so that the projected moment maps qualitatively resemble the observed stellar kinematics of NGC 3115. However, it is important to note that this model is not meant as a fit, in contrast with what is done when applying, for example, a Schwarzschild modelling procedure. Still, we manage to reproduce most of the observed structures (see Fig. 14), namely: the double maximum in the velocity profile along the major axis, the overall dispersion map with the central high-dispersion region extending along the minor axis, the h3 versus V anti-correlation along the major axis, and the amplitude of each moment over most of the field. The most surprising result comes from the correlation between h3 and V, which naturally emerges from the MGE model in the central 10′′ away from the major axis, which is very similar both in its extent and amplitude to the structure seen in the h3 MUSE map. Remarkably, we expected this structure to provide a strong hint of the presence of a tumbling bar, as mentioned above, but this dynamical MGE model tells us that an axisymmetric model following the light distribution of NGC 3115 can also reproduce this feature (with the help of the fast-rotating outer stellar component). This means that we cannot use the observed h3-V correlation as a strong indication that a bar is present in NGC 3115. We nevertheless witness a complex set of embedded structures with characteristic radii: inner and outer discs with radial extents of 3′′ and ~85′′, respectively, spiral-like features at 10′′, 40′′, and 60′′ in radius, all reflected in local or gradual changes in the observed photometry (Fig. 11), kinematics (Figs. 3 and 4), and partly stellar populations (Figs. 7 and 12). This is strongly reminiscent of a bar-driven evolution, which would indeed tend to lead to differentiation of properties such as mass, disciness and/or dynamical support, or metal distribution.
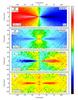 |
Fig. 14 As in Fig. 3, but for the dynamical model described in Sect. 5.2. The dashed contours indicate the MUSE pointings coverage. |
Barred galaxies are associated with specific orbital structures, together with regions localised by dynamical resonances (Sanders & Huntley 1976; Schwarz 1984; Sellwood & Wilkinson 2006). An inner disc is thus often the result of the reshaping of the central regions inside the inner Lindblad resonance(s) (ILR, 2:1 resonance), gas fueling, and subsequent star formation. Such a disc is visible as a first bump in the stellar kinematic profile (e.g. velocity and velocity dispersion), but can also be emphasised by further metal enrichment or connecting spiral-arms (Cole et al. 2014). The bar itself often ends close to the so-called ultra-harmonic resonance (UHR, 4:1 resonance) well inside the co-rotation radius (CR), again associated with spiral-arms and sometimes a resonant ring (which is squarish) (Buta & Combes 2003; Buta 1999). An outer disc may extend beyond the CR reaching out close to an outer oval ring at the outer Lindblad resonance (OLR, 2:1 resonance).
How relevant are such generic features to the ones we observe in NGC 3115? Using the mass MGE model, we estimated the location (axisymmetrised) of such bar-driven resonances by just computing the linear approximation for Ω, the circular frequency, and κ the first radial epicycle frequency. By assuming that the inner ring at R = 15−20′′ is the ILR, we can estimate the locations of the UHR, CR, and OLR. To account for uncertaintities in the mass model, and because this is an axisymmetric approximation, we also used a different MGE model where we fixed the local mass-to-light ratios of all Gaussians. We then get radii for the UHR, CR, and OLR of 35 ± 5′′, 50 ± 7′′, and 80 ± 10′′. The feature at ~ 40′′ (Sect. 5.1) could thus be associated with an UHR ring, often marking the end of the bar. The extent of such a bar would nicely correlate with the extent of metal-rich stars (Fig. 9, panel c). The location of the OLR would also roughly coincide with the outer overdensity at 75′′, also close to the end of the disc. A sketch of this scenario is provided in Fig. 15, where we present the deprojected versus the projected residual maps as in Fig. 11 (a sketch of the presumed inner spiral was presented in Emsellem 2002).
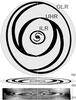 |
Fig. 15 a) Deprojected and b) projected sketches of the presumed spiral- and ring-like features observed in NGC 3115. c) HST residual image as in Fig. 11, panel a). |
Whether this picture is correct or not, the observed embedded structures suggest that NGC 3115 has been significantly re-shaped by a bar, although it does not tell us whether the bar itself is still present. To prove the presence of that bar would require a much more elaborate photometric and kinematic modelling or new observational signatures. Although having a bar in such a discy early-type galaxy is not necessarily a surprise, it is an important ingredient to keep in mind when trying to constrain the last 10 Gyr of NGC 3115 history, as this may have been a significant driver for the spatial distribution of metals.
5.3. Formation and evolution scenarios for NGC 3115
To explain the formation and evolution of early-type galaxies (ETG), the so-called two-phase scenario of Oser et al. 2010 has been quite extensively used and discussed (Arnold et al. 2014; Pastorello et al. 2015, and references therein), and suggested for NGC 3115 by Arnold et al. (2011). According to this scenario, ETG growth would first be dominated by in situ star formation at high redshift (z ≳ 2−3), triggered by dissipative gas collapse forming most of the central stellar mass. In a second phase, at intermediate to low redshifts (z ≲ 2−3), ETGs would mostly grow from accretion of stars, via minor mergers, that would populate the external part of galaxies. This difference of mass growth would be marked by a transition radius where the stellar kinematics and population properties would change noticeably.
From the mass assembly described in Sect. 4.3, we can infer that the stellar mass growth of most of the central region and disc components have been dominated by in situ star formation: at early epochs (t ≳ 12 Gyr, i.e. z ≳ 2−3) for its central region (central 15′′) and until a recent past (within the last 4 Gyr) for the stellar disc. The origin of the fast-rotating and flattened spheroid (~200 km s-1 at 3 Re) is still unclear, but it is quite unlikely to have originated from accretion of many low-mass stellar systems (M< 109M⊙). Accretion of satellites would most probably occur from various directions and would significantly lower the overall stellar angular momentum, thus tending towards a slow (or slower) rotating spheroid (Vitvitska et al. 2002; Bournaud et al. 2007; Qu et al. 2010) in striking contrast with what we observe within 4 Re. Furthermore, the overall metallicity of the stars in the spheroid ([Z / H] ~ −0.4 dex) would be hard to explain if predominantly assembled via stellar accretion of low-mass systems (with an average [Fe / H] ~ −1.5 to −0.7 dex for 107−9M⊙ galaxies; Kirby et al. 2013). The more metal-rich cores of low-mass galaxies may match the required metallicity (Koleva et al. 2011; Guérou et al. 2015), but this would then imply an even larger number of accreted systems (to account for the present day spheroid mass), hence constraining further their orbital angular momentum distribution.
As observationally suggested, stellar mass growth of galaxies below ~5 × 10¹⁰M⊙ should be dominated by in situ star formation, and galaxies more massive than ~1011M⊙ require significant merger events to rise to the region of high mass and large effective radii (Cappellari et al. 2013). This was suggested to be true at all redshifts (Rodriguez-Gomez et al. 2016), although there is clearly a large variation from galaxy to galaxy. According to their work, accretion of small stellar systems should account for ~10−30% of the total stellar mass of a galaxy in the mass range of NGC 3115 (see their Fig. 4), mostly detectable at ~4 Re (see their figure 10). Arnold et al. (2011) and Pastorello et al. (2015) also suggested a transition radius of 4 Re for NGC 3115 based on an observed decreasing rotation and different metallicity content of the globular cluster population at large radii. This would be consistent with the lack of strong evidence within the MUSE field of view (~4 Re) for ex situ star formation for NGC 3115, the galaxy also being near the mass transition (1011M⊙) mentioned earlier.
In such a context, an early merger event with few (thus relatively massive) progenitors would make more sense to explain the origin of the spheroidal component of NGC 3115 (within ~4 Re). Arnold et al. (2011) investigated this scenario and could not exclude that finely tuned simulations could reproduce such galaxy kinematics, in particular the surprisingly well-aligned rotation between the stellar disc and spheroid components. The flattened spheroidal component of NGC 3115 is rotating quite rapidly, as beautifully illustrated by the MUSE stellar kinematics. Such a high angular momentum may simply be the remnant of the orbital angular momentum associated with only a few merging large systems. Progenitors of 1010M⊙ and higher would also be consistent with the relatively high metallicity of the spheroid within 4 Re (McDermid et al. 2015). An early gas-rich merger event could thus explain the flattened spheroid, with the remnant gas reservoir filling in the rebuilding of a stellar disc structure (see e.g. Athanassoula et al. 2016) as observed in the MUSE data.
Finally, even though we cannot pinpoint the exact origin and evolution history of NGC 3115, it is clear that most of its stellar mass formed at a redshift z> 3, creating the roundish distribution of metal-poor stars that we currently see (within 4 Re), followed by a flattening of its spheroid (perhaps from a few merger events) by redshift z ~ 2. Since then, NGC 3115 has evolved nearly secularly through dynamical processes (mostly associated with the discy potential). We thus speculated on the role of a potential bar that could have redistributed gaseous and stellar mass and driven the formation of rings and spirals.
6. Conclusion
We presented MUSE commissioning data of NGC 3115, the most nearby S0 galaxy. This data set was obtained to demonstrate the great potential of the MUSE IFU instrument, mounted on the ESO VLT telescope, to cover extra-galactic sources at large radii (4−5 Re) in a reasonable amount of time (1h OB in the present case). We showed the mosaicing capacity of the instrument for diffuse objects, emphasising that the data quality has since been further improved thanks to a revised observation strategy and an updated reduction pipeline.
Through a detailed analysis of the stellar kinematics and population of NGC 3115, we revealed the two-dimensional structures of the different components of this galaxy – the spheroid, the intermediate-scale disc including spiral-like structures and rings, and the nuclear disc – and we briefly discussed the potential presence of a tumbling bar. We also presented a stellar population analysis, which for the first time has allowed us to provide a two-dimensional view of the star formation history, specifically disentangling the present day stellar population distribution in different bins according to age and metallicity.
Within 4 Re of NGC 3115’s spheroid component, although we find no direct evidence for an ex situ origin as expected from simulations for this galaxy mass range (~1.1 × 10¹¹M⊙), we suggest an early gas-rich merger event to explain the metallicity and the high rotation of the spheroid. The MUSE data also points towards the fact that NGC 3115 has evolved nearly secularly for the past 10 Gyr (since z ~ 2) allowing the long-term existence of a thin fast-rotating stellar disc with a gradually decreasing star formation rate.
This IFU data set emphasises the increasing need for new analysis tools to make the most of the overwhelming amount of information available. In particular, one further step forward would be to more closely connect the two-dimensional (gaseous and stellar) kinematics and stellar population information, looking at the multi-dimensional data set via the LOSVDs, age, and metallicity bins, which should provide an unprecedented view of the formation and mass assembly of galaxies. We believe that such a chemo-dynamical perspective will be the key to eventually solving some of the galaxy formation puzzles.
Python codes publicly available at the following address: http://www-astro.physics.ox.ac.uk/~mxc/software/
The MILES stellar library can be downloaded here: http://miles.iac.es/pages/stellar-libraries.php
We did not use the same libraries for the kinematics and stellar population analyses since the MILES library is optimised for precise radial velocities, therefore preferred for kinematics analysis, whereas the MIUSCAT models reproduce more accurately the continuum and absorption line shapes, critical for stellar population analysis.
Acknowledgments
This work is based on public data released from the MUSE commissioning observations at the VLT Yepun (UT4) telescope under Programme ID 60.A-9100(A). The authors want to warmly thank Joel Vernet, Fernando Selman and all the Paranal staff for their enthusiastic support of MUSE during the commissioning runs, Françoise Combes for the nice discussion, Johan Richard and Sandro Tacchella for useful comments, as well as Michele Cappellari for providing us with mass profile data. Finally, we thank the anonymous referee for the constructive report.
References
- Arnold, J. A., Romanowsky, A. J., Brodie, J. P., et al. 2011, AJ, 736, L26 [Google Scholar]
- Arnold, J. A., Romanowsky, A. J., Brodie, J. P., et al. 2014, AJ, 791, 80 [Google Scholar]
- Athanassoula, E., & Bureau, M. 1999, AJ, 522, 699 [Google Scholar]
- Athanassoula, E., Rodionov, S. A., Peschken, N., & Lambert, J. C. 2016, ApJ, 821, 90 [NASA ADS] [CrossRef] [Google Scholar]
- Bacon, R., Accardo, M., Adjali, L., et al. 2010, in Proc. SPIE, eds. I. S. McLean, S. K. Ramsay, & H. Takami, 7735, 773508 [Google Scholar]
- Bacon, R., Brinchmann, J., Richard, J., et al. 2015, A&A, 575, A75 [NASA ADS] [CrossRef] [EDP Sciences] [Google Scholar]
- Bekki, K., Couch, W. J., & Shioya, Y. 2002, AJ, 577, 651 [CrossRef] [Google Scholar]
- Bender, R., Saglia, R. P., & Gerhard, O. E. 1994, MNRAS, 269 [Google Scholar]
- Bois, M., Emsellem, E., Bournaud, F., et al. 2011, MNRAS, 416, 1654 [NASA ADS] [CrossRef] [Google Scholar]
- Bournaud, F., Jog, C. J., & Combes, F. 2007, A&A, 476, 1179 [NASA ADS] [CrossRef] [EDP Sciences] [Google Scholar]
- Brodie, J. P., Usher, C., Conroy, C., et al. 2012, AJ, 759, L33 [Google Scholar]
- Brodie, J. P., Romanowsky, A. J., Strader, J., et al. 2014, AJ, 796, 52 [CrossRef] [Google Scholar]
- Bryant, J. J., Owers, M. S., Robotham, A. S. G., et al. 2015, MNRAS, 447, 2857 [NASA ADS] [CrossRef] [Google Scholar]
- Bundy, K., Bershady, M. A., Law, D. R., et al. 2014, AJ, 798, 7 [CrossRef] [Google Scholar]
- Buta, R. 1999, Ap&SS, 269/270, 79 [Google Scholar]
- Buta, R., & Combes, F. 2003, Fund. Cosmic Phys., 17, 1 [Google Scholar]
- Cantiello, M., Blakeslee, J. P., Raimondo, G., et al. 2014, A&A, 564, L3 [NASA ADS] [CrossRef] [EDP Sciences] [Google Scholar]
- Capaccioli, M., Held, E. V., & Nieto, J.-L. 1987, AJ, 94, 1519 [NASA ADS] [CrossRef] [Google Scholar]
- Cappellari, M. 2008, MNRAS, 390, 71 [NASA ADS] [CrossRef] [Google Scholar]
- Cappellari, M., & Copin, Y. 2003, MNRAS, 342, 345 [NASA ADS] [CrossRef] [Google Scholar]
- Cappellari, M., & Emsellem, E. 2004, PASP, 116, 138 [NASA ADS] [CrossRef] [Google Scholar]
- Cappellari, M., Emsellem, E., Krajnović, D., et al. 2011, MNRAS, 413, 813 [NASA ADS] [CrossRef] [Google Scholar]
- Cappellari, M., McDermid, R. M., Alatalo, K., et al. 2013, MNRAS, 432, 1862 [NASA ADS] [CrossRef] [Google Scholar]
- Cappellari, M., Romanowsky, A. J., Brodie, J. P., et al. 2015, AJ, 804, L21 [CrossRef] [Google Scholar]
- Cenarro, A. J., Cardiel, N., Gorgas, J., et al. 2001, MNRAS, 326, 959 [NASA ADS] [CrossRef] [Google Scholar]
- Chung, A., & Bureau, M. 2004, AJ, 127, 3192 [NASA ADS] [CrossRef] [Google Scholar]
- Cole, D. R., Debattista, V. P., Erwin, P., Earp, S. W. F., & Roškar, R. 2014, MNRAS, 445, 3352 [NASA ADS] [CrossRef] [Google Scholar]
- Conroy, C., Gunn, J. E., & White, M. 2009, AJ, 699, 486 [NASA ADS] [CrossRef] [Google Scholar]
- Croom, S. M., Lawrence, J. S., Bland-Hawthorn, J., et al. 2012, MNRAS, 421, 872 [NASA ADS] [Google Scholar]
- Dekel, A., Sari, R., & Ceverino, D. 2009, AJ, 703, 785 [NASA ADS] [CrossRef] [Google Scholar]
- Duc, P.-A. A., Cuillandre, J.-C. C., Karabal, E., et al. 2014, MNRAS, 446, 120 [Google Scholar]
- Emsellem, E. 2002, in Disks of Galaxies: Kinematics, Dynamics and Peturbations, eds. E. Athanassoula, A. Bosma, & R. Mujica, ASP Conf. Ser., 275, 255 [Google Scholar]
- Emsellem, E. 2013, MNRAS, 433, 1862 [NASA ADS] [CrossRef] [Google Scholar]
- Emsellem, E., Monnet, G., & Bacon, R. 1994, A&A, 285, 723 [NASA ADS] [Google Scholar]
- Emsellem, E., Dejonghe, H., & Bacon, R. 1999, MNRAS, 303, 495 [NASA ADS] [CrossRef] [Google Scholar]
- Falcón-Barroso, J., Sánchez-Blázquez, P., Vazdekis, A., et al. 2011, A&A, 532, A95 [NASA ADS] [CrossRef] [EDP Sciences] [Google Scholar]
- Font, A. S., Mccarthy, I. G., Crain, R. A., et al. 2011, MNRAS, 416, 2802 [NASA ADS] [CrossRef] [Google Scholar]
- Forbes, D. a., Spitler, L. R., Strader, J., et al. 2011, MNRAS, 413, 2943 [NASA ADS] [CrossRef] [Google Scholar]
- García-Benito, R., Zibetti, S., Sánchez, S. F., et al. 2015, A&A, 576, A135 [NASA ADS] [CrossRef] [EDP Sciences] [Google Scholar]
- Gerhard, O. E. 1993, MNRAS, 265 [Google Scholar]
- Girardi, L., Bressan, A., Bertelli, G., & Chiosi, C. 2000, A&A, 141, 371 [Google Scholar]
- Guérou, A., Emsellem, E., McDermid, R. M., et al. 2015, AJ, 804, 70 [CrossRef] [Google Scholar]
- Hirschmann, M., Naab, T., Ostriker, J. P., et al. 2015, MNRAS, 449, 528 [NASA ADS] [CrossRef] [Google Scholar]
- Hoffman, L., Cox, T. J., Dutta, S., & Hernquist, L. 2010, AJ, 723, 818 [Google Scholar]
- Hopkins, P. F., Lauer, T. R., Cox, T. J., Hernquist, L., & Kormendy, J. 2009, ApJS, 181, 486 [NASA ADS] [CrossRef] [Google Scholar]
- Iannuzzi, F., & Athanassoula, E. 2015, MNRAS, 450, 2514 [NASA ADS] [CrossRef] [Google Scholar]
- Jennings, Z. G., Strader, J., Romanowsky, A. J., et al. 2014, AJ, 148, 32 [NASA ADS] [CrossRef] [Google Scholar]
- Karachentsev, I. D., & Kudrya, Y. N. 2014, AJ, 148, 50 [NASA ADS] [CrossRef] [Google Scholar]
- Kirby, E. N., Cohen, J. G., Guhathakurta, P., et al. 2013, AJ, 779, 102 [CrossRef] [Google Scholar]
- Kobayashi, C. 2004, MNRAS, 347, 740 [NASA ADS] [CrossRef] [Google Scholar]
- Koleva, M., Prugniel, P., De Rijcke, S., et al. 2011, MNRAS, 417, 1643 [NASA ADS] [CrossRef] [Google Scholar]
- Kormendy, J., & Richstone, D. 1992, AJ, 393, 559 [Google Scholar]
- Kormendy, J., Bender, R., Richstone, D., et al. 1996, AJ, 459 [Google Scholar]
- Krajnović, D., Bacon, R., Cappellari, M., et al. 2008, MNRAS, 390, 93 [NASA ADS] [CrossRef] [Google Scholar]
- Kuntschner, H., Ziegler, B. L., Sharples, R. M., Worthey, G., & Fricke, K. J. 2002, A&A, 395, 761 [NASA ADS] [CrossRef] [EDP Sciences] [Google Scholar]
- Lackner, C. N., Cen, R., Ostriker, J. P., & Joung, M. R. 2012, MNRAS, 425, 641 [NASA ADS] [CrossRef] [Google Scholar]
- Lauer, T. R., Ajhar, E. A., Byun, Y.-I., et al. 1995, AJ, 110, 2622 [NASA ADS] [CrossRef] [EDP Sciences] [Google Scholar]
- Li, J. T., & Wang, Q. D. 2013, MNRAS, 428, 2085 [NASA ADS] [CrossRef] [Google Scholar]
- Li, J.-T., Daniel Wang, Q., Li, Z., & Chen, Y. 2011, AJ, 737, 41 [CrossRef] [Google Scholar]
- Maraston, C. 2005, MNRAS, 362, 799 [NASA ADS] [CrossRef] [Google Scholar]
- Martínez-Delgado, D., Gabany, R. J., Crawford, K., et al. 2010, AJ, 140, 962 [NASA ADS] [CrossRef] [Google Scholar]
- McDermid, R. M., Alatalo, K., Blitz, L., et al. 2015, MNRAS, 448, 3484 [NASA ADS] [CrossRef] [Google Scholar]
- Michard, R. 2007, A&A, 464, 507 [NASA ADS] [CrossRef] [EDP Sciences] [Google Scholar]
- Naab, T., Johansson, P. H., & Ostriker, J. P. 2009, AJ, 699, L178 [NASA ADS] [CrossRef] [Google Scholar]
- Navarro-González, J., Ricciardelli, E., Quilis, V., & Vazdekis, A. 2013, MNRAS, 436, 3507 [NASA ADS] [CrossRef] [Google Scholar]
- Nieto, J.-L., Bender, R., Arnaud, J., & Surma, P. 1991, A&A, 244, L25 [NASA ADS] [Google Scholar]
- Norris, M. A., Sharples, R. M., & Kuntschner, H. 2006, MNRAS, 367, 815 [NASA ADS] [CrossRef] [Google Scholar]
- Oser, L., Ostriker, J. P., Naab, T., Johansson, P. H., & Burkert, A. 2010, AJ, 725, 13 [Google Scholar]
- Pastorello, N., Forbes, D. A., Usher, C., et al. 2015, MNRAS, 451, 2625 [NASA ADS] [CrossRef] [Google Scholar]
- Pipino, A., D’Ercole, A., Chiappini, C., & Matteucci, F. 2010, MNRAS, 407, 1347 [NASA ADS] [CrossRef] [Google Scholar]
- Press, W. H., Teukolsky, S. A., Vetterling, W. T., & Flannery, B. P. 1992, Numerical recipes in C. The art of scientific computing (Cambridge University Press) [Google Scholar]
- Qu, Y., Matteo, P. D., Lehnert, M., et al. 2010, A&A, 515, A11 [NASA ADS] [CrossRef] [EDP Sciences] [Google Scholar]
- Rodriguez-Gomez, V., Pillepich, A., Sales, L. V., et al. 2016, MNRAS, 458, 2371 [NASA ADS] [CrossRef] [Google Scholar]
- Roediger, J. C., Courteau, S., MacArthur, L. A., & McDonald, M. 2011, MNRAS, 416, 1996 [NASA ADS] [CrossRef] [Google Scholar]
- Salpeter, E. E. 1955, AJ, 121, 161 [NASA ADS] [CrossRef] [Google Scholar]
- Sánchez, S. F., Kennicutt, R. C., Gil de Paz, A., et al. 2012, A&A, 538, A8 [NASA ADS] [CrossRef] [EDP Sciences] [Google Scholar]
- Sanchez-Blazquez, P., Peletier, R. F., Jimenez-Vicente, J., et al. 2006, MNRAS, 371, 703 [NASA ADS] [CrossRef] [Google Scholar]
- Sanders, R. H., & Huntley, J. M. 1976, AJ, 209, 53 [Google Scholar]
- Sarzi, M., Falcon-Barroso, J., Davies, R. L., et al. 2006, MNRAS, 366, 1151 [NASA ADS] [CrossRef] [Google Scholar]
- Savorgnan, G. A. D., & Graham, A. W. 2016, MNRAS, 457, 320 [NASA ADS] [CrossRef] [Google Scholar]
- Schiavon, R. P. 2007, ApJS, 171, 146 [NASA ADS] [CrossRef] [Google Scholar]
- Schwarz, M. P. 1984, MNRAS, 209, 93 [NASA ADS] [CrossRef] [Google Scholar]
- Scorza, C., & Bender, R. 1995, A&A, 293, 20 [NASA ADS] [Google Scholar]
- Sellwood, J. A. 2010, MNRAS, 410, 1637 [Google Scholar]
- Sellwood, J. A., & Wilkinson, A. 2006, Rep. Prog. Phys., 56, 82 [Google Scholar]
- Thomas, D., Greggio, L., & Bender, R. 1999, MNRAS, 302, 537 [NASA ADS] [CrossRef] [Google Scholar]
- van der Marel, R. P., & Franx, M. 1993, AJ, 407, 525 [Google Scholar]
- van Dokkum, P. G., Abraham, R., & Merritt, A. 2014, AJ, 782, L24 [NASA ADS] [CrossRef] [Google Scholar]
- Vazdekis, A. 1999, AJ, 513, 224 [Google Scholar]
- Vazdekis, A., Ricciardelli, E., Cenarro, A. J., et al. 2012, MNRAS, 424, 157 [NASA ADS] [CrossRef] [Google Scholar]
- Vazdekis, A., Coelho, P., Cassisi, S., et al. 2015, MNRAS, 449, 1177 [NASA ADS] [CrossRef] [Google Scholar]
- Vitvitska, M., Klypin, A. A., Kravtsov, A. V., et al. 2002, AJ, 581, 799 [Google Scholar]
- Weilbacher, P. 2015, in Science Operations 2015: Science Data Management − An ESO/ESA Workshop, 1 [Google Scholar]
- Weilbacher, P. M., Streicher, O., Urrutia, T., et al. 2012, in Proc. SPIE, eds. N. M. Radziwill, & G. Chiozzi, 8451, 84510 [Google Scholar]
- Weilbacher, P. M., Monreal-Ibero, A., Kollatschny, W., et al. 2015, A&A, 582, A114 [NASA ADS] [CrossRef] [EDP Sciences] [Google Scholar]
- Wong, K.-W., Irwin, J. A., Yukita, M., et al. 2011, AJ, 736, L23 [CrossRef] [Google Scholar]
- Wrobel, J. M., & Nyland, K. 2012, AJ, 144, 160 [NASA ADS] [CrossRef] [Google Scholar]
- Zolotov, A., Willman, B., Brooks, A. M., et al. 2009, AJ, 702, 1058 [Google Scholar]
All Figures
|
Fig. 1 Panel a) MUSE reconstructed V-band image of NGC 3115 obtained through the MUSE pipeline. Panel b) photometric V-band model of NGC 3115 from Emsellem et al. (1999). The model flux is scaled to the MUSE V-band image, which is in arbitrary units. Panel c) normalised residuals of the MUSE reconstructed V-band image obtained by subtracting the Emsellem et al. (1999) model. The overall flatness of the residuals shows the good quality of our data reduction process (see Sect. 2.2). The significant residual structures (inner-disc, spirals, etc.) are discussed in Sect. 5.1. |
| In the text | |
|
Fig. 2 Stellar kinematics fits a) of the central spaxel and b) the lowest S/N spectrum of our MUSE NGC 3115 data cube. The fits were performed with the pPXF software (Cappellari & Emsellem 2004) over the wavelength range 4760−6850 Å and using the MILES stellar library (Sanchez-Blazquez et al. 2006; Falcón-Barroso et al. 2011). The black lines show the MUSE spectra, the red lines the best fits, the shaded green areas the wavelength ranges not fitted (i.e. corresponding to the sky lines regions), and the green crosses the fit residuals (shifted upwards by 0.5 along the y-axis). The top right box in each panel indicates the respective S/N of the MUSE spectrum showed. |
| In the text | |
|
Fig. 3 Maps of the first four line-of-sight velocity distribution (LOSVD) moments: a) mean stellar radial velocity, V; b) mean stellar velocity dispersion, σ; c) third-order Gauss-Hermite moment, h3; and d) fourth-order Gauss-Hermite moment, h4. The colour scheme for each panel is indicated in the bottom left corner. The kinematics maps clearly show a thin, kinematically cold, fast-rotating disc embedded in a kinematically hotter, rotating spheroid. We note the correlation between h3 and V in the central 15′′, away from the major axis, suggesting the central bar that we discuss in Sect. 5.2. |
| In the text | |
|
Fig. 4 One-dimensional curve of the first four line-of-sight velocity distribution (LOSVD) moments: a) stellar radial velocity, V; b) stellar velocity dispersion, σ; c) third-order Gauss-Hermite moment, h3; d) fourth-order Gauss-Hermite moment, h4. The points were extracted from the two-dimensional maps of the respective quantities (see Fig. 3), by taking the light-weighted mean value within a 2′′ wide slit, aligned with the major axis (orange points), and offset by +8′′ (green points) and +20′′ (blue points) along the minor axis. |
| In the text | |
|
Fig. 5 Maps of the stellar population of NGC 3115 obtained through regularised full spectral fitting: a) mass weighted age; and b) mass weighted metallicity, [Z/H]. The colour code for each panel is indicated on its top left corner. We observe a clear distinction of age between the disc and the spheroid component of NGC 3115, as well as a clear metallicity gradient along the major and minor axis of the stellar disc. |
| In the text | |
|
Fig. 6 Stellar age (mass-weighted) versus V/σ, the ratio of the stellar radial velocity and velocity dispersion, for each spaxel of NGC 3115 MUSE cube. The spaxels corresponding to the fast-rotating disc (|V/σ| > 1) have younger stellar ages (9–13 Gyr) whereas the pressure supported regions of NGC 3115 (|V/σ| < 1) show a rather uniform and old stellar age distribution (≥13 Gyr). The younger stellar population observed in Fig. 5 is therefore well associated to the fast-rotating disc observed in Fig. 3. To help reading the figure, we indicate the age of 13 Gyr by an horizontal dashed line, and plot the mean and standard deviation of the points distribution in ten bins of V/σ. |
| In the text | |
|
Fig. 7 Stellar mass fraction maps of NGC 3115 in six age bins, obtained by projecting the stellar model weighting distribution solution, obtained with pPXF, onto the grid parameters (Age, [Z/H]). For each panel, the age bin limits are indicated in the top left corner, the mean stellar mass fraction in the top right corner, and the colour scheme by the colour bar at the top of the figure. Spaxels containing a stellar mass fraction lower than 0.03 are masked and are considered below our uncertainties. The galaxy orientation is similar to Fig. 3. The extended star formation history of the outer disc component is clearly visible in the first four panels (a) to d)), whereas the stars present in the spheroid were formed early (age ≥ 10 Gyr), with more than 85% of its stellar mass formed between 12−14 Gyr (panels e) and f)). |
| In the text | |
|
Fig. 8 Stellar mass maps of NGC 3115 in six age bins, as in Fig. 7. These maps show the present day stellar mass distribution as a function of its mass-weighted age. For each panel, the total stellar mass per age bin (in solar mass) is indicated in the bottom right corner and the colour scheme limits (corresponding to the colour bar at the top) are in the bottom left corner, and differ from each another. The noticeable change in the shape of the iso-mass contours between 10−12 Gyr and 12−14 Gyr, from rather flat to more spheroidal, suggests a more dissipative mass assembly at early epoch (age > 12 Gyr) possibly from a major merger. Panels a) to c) suggest that extended star formation occurred in situ in the disc component of NGC 3115. |
| In the text | |
|
Fig. 9 Stellar mass fraction maps of NGC 3115, in four bins of metallicity, marginalised over age. For each panel, the metallicity bin limits are indicated on its top left corner, the mean stellar mass fraction on its top right corner, and the colour scheme by the colour bar at the top of the figure. Spaxels containing a stellar mass fraction lower than 0.03 are masked, considered below our uncertainties. The galaxy orientation is the same as Fig. 3. It is remarkable that the central 10′′ where the inner disc resides, are made of only metal-rich stars (panel d)). The disc component has very little metal-poor stars (panels a) and b)), and the spheroid of NGC 3115 has a flat distribution over the four metallicity bins, from metal-rich to metal-poor. |
| In the text | |
|
Fig. 10 Stellar mass fraction of NGC 3115 in four bins of age/metallicity pairs: young (age ≲ 12 Gyr), old (age > 12 Gyr), metal-rich ([Z/H] = 0.2 dex), and metal-poor ([Z/H] < 0.2 dex). For each panel, the age and metallicity bin limits are indicated in the top left corner, the mean stellar mass fraction in the top right corner, and the colour scheme by the colour bar at the top of its respective column. The old and metal-poor stellar population of NGC 3115 is mostly located in its spheroid component, whereas the young and metal-rich stars are mostly in the disc component. |
| In the text | |
|
Fig. 11 a) ACS/HST residuals after removal of the MGE photometric model (Emsellem et al. 1999); b) unsharp masking of the HST image; c) zoom corresponding to the dashed rectangle of the unsharp masking image (panel b). |
| In the text | |
|
Fig. 12 Smoothed version of the stellar age map of NGC 3115; the ACS/HST residual contours are over-plotted. We plot only the zero-level contours corresponding to the potential spiral-arms in order to lighten their boundaries. A clear spatial match is observed between the spiral-like residual structures and the youngest stellar population observed. |
| In the text | |
|
Fig. 13 Third Gauss-hermite moment, h3, versus V/σ for each spaxel of NGC 3115 MUSE cube. Blue dots represent the spaxels corresponding to the nuclear-disc (central 3′′ × 1′′) of NGC 3115. |
| In the text | |
|
Fig. 14 As in Fig. 3, but for the dynamical model described in Sect. 5.2. The dashed contours indicate the MUSE pointings coverage. |
| In the text | |
|
Fig. 15 a) Deprojected and b) projected sketches of the presumed spiral- and ring-like features observed in NGC 3115. c) HST residual image as in Fig. 11, panel a). |
| In the text | |
Current usage metrics show cumulative count of Article Views (full-text article views including HTML views, PDF and ePub downloads, according to the available data) and Abstracts Views on Vision4Press platform.
Data correspond to usage on the plateform after 2015. The current usage metrics is available 48-96 hours after online publication and is updated daily on week days.
Initial download of the metrics may take a while.