Fig. 2
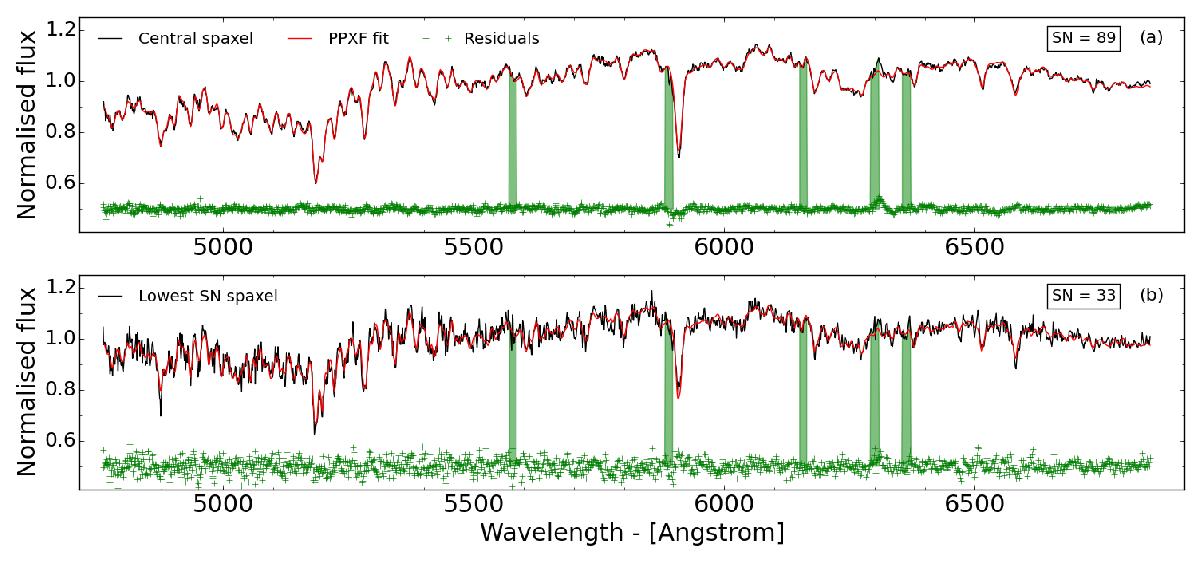
Stellar kinematics fits a) of the central spaxel and b) the lowest S/N spectrum of our MUSE NGC 3115 data cube. The fits were performed with the pPXF software (Cappellari & Emsellem 2004) over the wavelength range 4760−6850 Å and using the MILES stellar library (Sanchez-Blazquez et al. 2006; Falcón-Barroso et al. 2011). The black lines show the MUSE spectra, the red lines the best fits, the shaded green areas the wavelength ranges not fitted (i.e. corresponding to the sky lines regions), and the green crosses the fit residuals (shifted upwards by 0.5 along the y-axis). The top right box in each panel indicates the respective S/N of the MUSE spectrum showed.
Current usage metrics show cumulative count of Article Views (full-text article views including HTML views, PDF and ePub downloads, according to the available data) and Abstracts Views on Vision4Press platform.
Data correspond to usage on the plateform after 2015. The current usage metrics is available 48-96 hours after online publication and is updated daily on week days.
Initial download of the metrics may take a while.