| Issue |
A&A
Volume 591, July 2016
|
|
|---|---|---|
| Article Number | L1 | |
| Number of page(s) | 5 | |
| Section | Letters | |
| DOI | https://doi.org/10.1051/0004-6361/201628689 | |
| Published online | 03 June 2016 | |
Understanding the C3H2 cyclic-to-linear ratio in L1544
Max-Planck-Institute for Extraterrestrial Physics (MPE),
Giessenbachstr. 1,
85748
Garching,
Germany
e-mail:
This email address is being protected from spambots. You need JavaScript enabled to view it.
Received: 11 April 2016
Accepted: 23 May 2016
Abstract
Aims. We aim to understand the high cyclic-to-linear C3H2 ratio (32 ± 4) that has been observed toward L1544.
Methods. We combined a gas-grain chemical model with a physical model for L1544 to simulate the column densities of cyclic and linear C3H2 observed toward L1544. The most important reactions for the formation and destruction of both forms of C3H2 were identified, and their relative rate coefficients were varied to find the best match to the observations.
Results. We find that the ratio of the rate coefficients of C3H3+ + e− ➝ C3H2 + H for cyclic and linear C3H2 must be ~ 20 to reproduce the observations, depending on the branching ratios assumed for the C3H3+ + e− ➝ C3H + H2 reaction. In current astrochemical networks it is assumed that cyclic and linear C3H2 are formed in a 1:1 ratio in the aforementioned reactions. Laboratory studies and/or theoretical calculations are needed to confirm the results of our chemical modeling, which is based on observational constraints.
Key words: ISM: abundances / ISM: clouds / ISM: molecules / astrochemistry
© ESO, 2016
1. Introduction
Isomers and isotopologs are excellent tools to probe physical and chemical properties, as well as evolutionary states, in the ISM. Cyclopropenylidene, the cyclic form of C3H2, is one of the most abundant and widespread molecules in our Galaxy (Matthews & Irvine 1985). Propadienylidene, H2CCC, is a very polar carbene and is the less stable isomer of c-C3H2 by ~10 kcal mol-1 (5000 K; Wu et al. 2010). Propadienylidene was first detected in the laboratory by Vrtilek et al. (1990) by means of millimetrer-wave absorption spectroscopy in a DC discharge. It has been observed in prestellar and protostellar cores (Cernicharo et al. 1991; Turner et al. 2000; Kawaguchi et al. 1991; Sakai & Yamamoto 2013), circumstellar envelopes (Cernicharo et al. 1991), translucent clouds (Turner et al. 2000), diffuse clouds (Cernicharo et al. 1999; Kulczak-Jastrzȩbska et al. 2012; Liszt et al. 2012), and photodissociation regions (PDRs; Teyssier et al. 2005; Cuadrado et al. 2015).
The cyclic-to-linear (hereafter c/l) ratio of C3H2 tends to increase with increasing AV. Significant variations of this ratio are found in dense cores, ranging from 25 in TMC-1(CP) to 67 in TMC-1C (Spezzano et al. 2016). For completeness, we report in Table A.1 the values of the C3H2c/l ratio observed in several media, including dense cores. To be able to model the observed c/l ratios use this ratio as an astrochemical tool, the chemistry leading to the formation and destruction of c-C3H2 and H2CCC (hereafter l-C3H2) needs to be better understood, with emphasis on the branching ratios of the reactions involved.
The main formation process of cyclic and linear C3H2 involves the radiative association of C3H+ and H2 to form cyclic and linear C3H and a subsequent dissociative recombination with electrons that leads to c-C3H2 and l-C3H2, respectively. C3H+ exists in both cyclic and linear forms, but the cyclic isomer lies 17 kcal mol-1 (8600 K) above the linear one (Ikuta 1997), hence for our purposes we can assume to deal with l-C3H+ only. The radiative association of l-C3H+ and H2 will form cyclic and linear C3H in a 1:1 ratio (Maluendes et al. 1993). Talbi et al. (2009) suggested with their calculations that the dissociative recombination of c-C3H to form c-C3H2 is more efficient than its linear counterpart. Using an afterglow experiment at 300 K, Adams & Babcock (2005) observed that the cyclic C3H recombines faster than the linear isomer.
The chemistry of c and lC3H2 and that of other associated species has previously been modeled for instance by Turner et al. (2000) and Fossé et al. (2001). Both of these works pointed out that neutral-neutral reactions can also play a part in determining the C3H2c/l ratio. The rate coefficients of the reactions most relevant in the present context have changed a little since these studies.
A key point of the dissociative recombination of C3H is its branching ratio, which unfortunately has not yet been investigated either experimentally or theoretically. Chabot et al. (2013) studied the dissociative recombination of cyclic and linear C3H . Their results show that while c-C3H is the main product of the dissociative recombination of c-C3H with electrons, l-C3H is not the main product of the recombination of l-C3H. In this work we study the effect of the branching ratios of the dissociative recombination of both cyclic and linear C3H on the cyclic-to-linear ratio of C3H2. We use the well-studied prestellar core L1544 to compare the results of our model with the observational results.
Branching ratios for  from the KIDA database.
2. Formation and destruction of C3H2
In physical conditions with high visual extinction (AV > a few mag) where photoprocesses do not play a significant role, the formation and destruction of (cyclic and linear) C3H2 follow a relatively simple scheme. The main formation pathway is the dissociative recombination  . In this paper, we use the latest rate coefficient data from the KIDA database (Wakelam et al. 2015; see also below), where three different branches for this reaction are included. These are tabulated in Table 1. The third tabulated reaction for both forms of C3H2, whose rate coefficient we label here as kDR,3, is the most important for the C3H2 formation because it produces C3H2 directly (see also Sect. 4).
The main destruction partners of C3H2 change with time, but at the time when C3H2 is the most abundant (see Sects. 3 and 4), the main destruction reactions are ion-molecule reactions that convert C3H2 back to  :
:  with rate coefficients k1, k2, and k3, respectively. Thus, the abundance of C3H2 in steady state would be given by
 ![Mathematical equation: \begin{equation} \Bigl[ {\rm C_3H_2} \Bigr] = \frac{ k_{\rm DR,3} \Bigl[ \rm C_3H_3^+ \Bigr] \Bigl[ \rm e^- \Bigr] } { k_1 \Bigl[ {\rm HCO^+} \Bigr] + k_2 \Bigl[ {\rm H_3O^+} \Bigr] + k_3 \Bigl[ {\rm H_3^+} \Bigr]} , \end{equation}](/articles/aa/full_html/2016/07/aa28689-16/aa28689-16-eq39.png) (1)which leads to an expression of the c/l ratio of C3H2
(1)which leads to an expression of the c/l ratio of C3H2![Mathematical equation: \begin{eqnarray} \label{c_to_l} \frac{ \Bigl[ {c{\textrm -}\rm C_3H_2} \Bigr] }{ \Bigl[ {l{\textrm -}\rm C_3H_2} \Bigr] } &=& \frac{ k_{\rm DR,3}^c \Bigl[c{\textrm -}\rm C_3H_3^+ \Bigr] \Bigl[ \rm e^- \Bigr] }{ k_{\rm DR,3}^l \Bigl[ l{\textrm -}\rm C_3H_3^+ \Bigr] \Bigl[ \rm e^- \Bigr] } \nonumber \\ &&\quad \times \frac{ k_1^l \Bigl[ {\rm HCO^+} \Bigr] + k_2^l \Bigl[ {\rm H_3O^+} \Bigr] + k_3^l \Bigl[ {\rm H_3^+} \Bigr]}{ k_1^c \Bigl[ {\rm HCO^+} \Bigr] + k_2^c \Bigl[ {\rm H_3O^+} \Bigr] + k_3^c \Bigl[ {\rm H_3^+} \Bigr]} \cdot \end{eqnarray}](/articles/aa/full_html/2016/07/aa28689-16/aa28689-16-eq40.png) (2)Because of gas-grain chemical interaction, a steady-state solution is not attained in our models, but the above expressions turn out to give a rather accurate representation of the C3H2 peak abundances. Inspection of the KIDA data reveals that the rate coefficients of the three C3H2-destroying ion-molecule reactions discussed above are almost identical (slightly higher for l-C3H2 than for c-C3H2), so that the latter fraction in Eq. (2) is ~1. Furthermore, our chemical model (see below) indicates that the c-/l- ratio is usually also very close to unity, so that the c-C3H2/l-C3H2 ratio is determined to a good approximation by the rate coefficient ratio
(2)Because of gas-grain chemical interaction, a steady-state solution is not attained in our models, but the above expressions turn out to give a rather accurate representation of the C3H2 peak abundances. Inspection of the KIDA data reveals that the rate coefficients of the three C3H2-destroying ion-molecule reactions discussed above are almost identical (slightly higher for l-C3H2 than for c-C3H2), so that the latter fraction in Eq. (2) is ~1. Furthermore, our chemical model (see below) indicates that the c-/l- ratio is usually also very close to unity, so that the c-C3H2/l-C3H2 ratio is determined to a good approximation by the rate coefficient ratio  at the time when HCO+, H3O+, and
  are abundant (i.e., before the onset of freeze-out of neutrals onto grain surfaces). This ratio is unity in the KIDA data, which implies c-C3H2/l-C3H2 ~ 1 according to the approximating formula presented above. However, the observed c/l abundance ratio toward the dust peak in L1544 is 32 ± 4 (Spezzano et al. 2016). We therefore set out to modify the various kDR branching ratios to explain the observations. The assumption that the two isomers are formed in the same fashion and in similar conditions is strengthened by our recent maps of c and lC3H2 in the inner 2.5′ × 2.5′ of L1544, which demonstrate that c and lC3H2 trace the same region (Spezzano et al., in prep.). A spatial association of c and lC3H2 has also been observed in other sources (e.g., Fossé et al. 2001).
Branching ratios calculated for (c/l)- by Chabot et al. (2013).
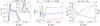 |
Fig. 1 Left panel: abundances of c-C3H2 (solid lines) and l-C3H2 (dotted lines) as functions of distance from the core center in the L1544 model at t = 105 yr. Middle panel: C3H2c/l ratio as a function of distance from the core center in the L1544 model at t = 105 yr. Right panel: density (green solid line), dust temperature (red solid line), and gas temperature (red dashed line) as functions of distance from the core center in the L1544 model of Keto et al. (2014). The different colors in the left and middle panels correspond to |

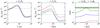 |
Fig. 2 Column densities (convolved to a 30′′ beam) of c-C3H2 (left panel) and l-C3H2 (middle panel), and the C3H2c/l column density ratio (right panel) as functions of time toward the center of the L1544 model. The different colors correspond to |
As a guide to the modifications, we analyzed the branching ratios calculated for the reaction by Chabot et al. (2013). These branching ratios, which are included in the KIDA database, are shown in Table 2. Calculations for the system are planned, but it is unclear when the results will be available (M. Chabot, priv. comm.). Therefore, we used the system as a template for the modifications. In the dissociation of  , there are pathways that remove either one or both protons from and pathways that break C-C bonds, that is, there are three groups of pathways. Inspection of the pathways (Table 1) reveals a similar grouping. As a first approximation we combined the branching ratios belonging to each group in the data and translated them into the system. This leads to the branching ratios given in Table 3 (mod_ch). In this modified model, the ratio is ~5, which is still not high enough in light of the observations. We then proceeded to vary the branching ratios to attain a fit to the observed C3H2c/l ratio in L1544. The results of our analysis are presented in Sect. 3.
Modified branching ratios for (c/l)- based on the (c/l)- data from Chabot et al. (2013) (labeled mod_ch), and an ad hoc approach (mod_hr; “hr” stands for “high ratio”).
To simulate the C3H2 abundances in L1544, we used the physical model for L1544 presented by Keto & Caselli (2010) and updated by Keto et al. (2014), which gives us the density, (gas and dust) temperature, and AV profiles as functions of distance away from the dust peak. We separated the model core to concentric shells and calculated the chemical evolution separately in each shell. In this way, we can produce simulated chemical abundance gradients and study how the column densities of the various molecules change as functions of time. A similar procedure has been used to successfully model the emission and absorption of the ortho and para H2D+ ground-state rotational lines toward IRAS 16293A (Brünken et al. 2014). The (gas-grain) chemical code used here is described in detail in Sipilä et al. (2015a). The gas-phase chemical reaction set used in the present work is based on the latest KIDA reaction file (Wakelam et al. 2015), which was deuterated and spin-state separated according to the prescriptions of Sipilä et al. (2015a) and Sipilä et al. (2015b). However, in this paper we do not explicitly consider spin states or deuteration. The physical parameters of the model and the initial chemical abundances are adopted from Tables 1 and 3 in Sipilä et al. (2015a) except for the ratio of diffusion to binding energy (Ed/Eb), for which we adopt here a value of 0.60, in line with the recent results of Minissale et al. (2016).
3. Results
We calculated the abundances and column densities of c-C3H2 and l-C3H2 in the L1544 model with a grid of values for the ratio, ranging from 1/1 (the KIDA value) up to 50/2 (mod_hr, Table 3). We plot in Fig. 1 the abundances of c-C3H2 and l-C3H2 and the C3H2c/l ratio at t = 105 yr assuming three different values for . We also show the density and temperature structures of the L1544 core model (Keto et al. 2014) for completeness. Additional calculations (not shown) indicate a simple increasing trend of the C3H2c/l ratio with . Evidently, neither the KIDA model nor our initial modified model (mod_ch) produce a high enough c/l ratio, and a high is needed to produce a c/l ratio comparable to the observed value.
To supplement the results shown in Fig. 1, we show in Fig. 2 the column densities of cyclic and linear C3H2 and their ratio as functions of time toward the center of the L1544 model. We also show the observed values (Spezzano et al. 2016). The simulated column densities were convolved to a 30′′ beam so that they correspond to the observations. The peak value of the C3H2c/l ratio is ~32, which corresponds to 8 × 10⁴ yr of chemical evolution. The best fit to the observations is attained at t ~ 105 yr, when the column densities of both species and their ratio are all within the observed limits. The timescale required to attain the best fit depends on the initial chemical abundances, and so our results do not necessarily reflect the “absolute” age of the core. However, it is clear that we can only attain a high enough C3H2c/l ratio with the model if the production of cyclic C3H2 is strongly boosted over that of linear C3H2 in the dissociation of .
4. Discussion and conclusions
The branches (Tables 1 and 3) show that the branch listed second ( ) forms C3H, which can be converted back into C3H2 through the sequence C3H + H+ ➝ C3H+ + H;
  ;
;  . Therefore it seems reasonable to assume that increasing
  would further increase the C3H2c/l ratio. We tested this by modifying the and
  ratios, keeping fixed at 50/2. We found that increasing
  and decreasing
  by 10%1 further increases the peak C3H2c/l ratio to ~40, while decreasing and increasing by 10% leads to a peak C3H2c/l ratio of ~26. Therefore we can attain a good fit to the observations with several combinations of the kDR,2 and kDR,3 values, and it is difficult to derive strict upper limits to acceptable values of the branching ratios based on the present analysis. However, our calculations indicate that the effect of is greater than that of in determining the C3H2c/l ratio. This is because the former pathway is a direct source of C3H2 while the latter pathway depends on multiple reactions (see above) that can also form species other than C3H2. We require clearly higher than unity. We note that the C3Hc/l ratio is in our models nearly independent of the various kDR,n values, and is ~3 at the time of the C3H2 peak, increasing to ~10 at later times (as the C3H2c/l ratio decreases). These values agree with observations (Turner et al. 2000; Fossé et al. 2001; Cuadrado et al. 2015). However, because of its weak dependence on kDR,n, the C3Hc/l ratio cannot be used to constrain the branching ratios of the process.
Figure 2 demonstrates that the C3H2c/l ratio is not constant in time, meaning that the approximation of Eq. (2) does not hold universally. For the highest ratio tested here (50/2, Table 3), the C3H2c/l ratio presents a maximum for a relatively brief period of time and finally settles to ~15. Our chemical model shows that at late times the slow neutral-neutral reaction H + CH2CCH ➝ H2 + C3H2 is a significant source of C3H2. Because the ratio is so high, this neutral-neutral reaction is the most important formation pathway for l-C3H2 (and the second most important pathway for c-C3H2), so that the C3H2c/l ratio is no longer controlled solely by . This finding is in line with previous discussions by Turner et al. (2000) and Fossé et al. (2001).
Figure 1 shows that the C3H2c/l abundance ratio presents a minimum about 10 000 AU away from the core center and increases again at larger radii. This behavior is a result of changing physical conditions, particularly the visual extinction. A detailed analysis of our results reveals that around 10 000 AU at t = 105 yr, the formation of linear C3H2 is governed by reactions other than because of its low rate coefficient, while at still higher radii photochemistry comes into play and the reaction is again the dominant formation pathway for both cyclic and linear C3H2. However, the abundances are very low in the outer core; by far the largest part of the cyclic and linear C3H2 column densities comes from the interval ~3000–7000 AU.
The total rate coefficient for assumed in the earlier modeling works of Turner et al. (2000) and Fossé et al. (2001) is equal to that adopted here (Table 1) within a factor of two. Although only a limited amount of rate coefficient data is quoted in Turner et al. (2000) and Fossé et al. (2001), it seems that the rate coefficients for the main reactions in the present context have not significantly changed in the past two decades. Still, it is clear from all the models that the observed c/l ratios can only be reproduced if the relative rate coefficients for the formation and destruction of the various c and l species have different values.
As stated in the Introduction and expanded upon in Appendix A, the C3H2c/l ratio has been observed toward various environments (e.g., protostellar cores and diffuse clouds) with values ranging from 3 to ~70. The observations show a trend of increasing C3H2c/l ratio at increasing AV. The analysis presented above demonstrates that various reactions can be responsible for the formation of C3H2 (and hydrocarbons in general; see Alata et al. 2014, 2015; Duley et al. 2015). We cannot, based on the present models, draw quantitative conclusions on the expected C3H2c/l ratio in objects other than L1544 without detailed (physical) modeling, particularly toward environments with low gas density and low AV. Such an undertaking is beyond the scope of this Letter. As an example of the interpretational difficulty, we note that the C3H2c/l ratio in the outer parts of the L1544 model, which is roughly consistent with a PDR in terms of physical conditions, follows the ratio (Fig. 1), and we checked that the C3H2c/l column density ratio is indeed high (~17–35 depending on the time) even 100′′ away from the core center. This agrees with the observations (Spezzano et al., in prep.).
We conclude that to explain the C3H2c/l ratio observed toward L1544 (32 ± 4; Spezzano et al. 2016), the branching ratios of the various outcomes of the reaction should be adjusted to favor cyclic C3H2 over linear C3H2. In physical conditions with moderate visual extinction, the most important reaction determining the C3H2c/l ratio is , followed by . It is currently assumed in the KIDA database that c and lC3H2 are created in equal proportions in both the former and the latter reaction. However, our modeling results suggest that the ratio of the rate coefficients in the former reaction for cyclic and linear C3H2 should be of the order of ~20 depending on what is assumed for the latter reaction. Unfortunately, we cannot set strict limits on the branching ratios based on our current analysis. More theoretical and/or laboratory work is clearly needed to understand the chemistry of C3H2.
By this we mean an increase or decrease of the branching ratio by 10 units of percentage, as opposed to 10% of the original value.
Acknowledgments
We thank the anonymous referee for helpful comments and suggestions that improved the manuscript. We acknowledge the financial support of the European Research Council (ERC; project PALs 320620).
References
- Adams, N. G., & Babcock, L. M. 2005, J. Phys. Conf. Ser., 4, 38 [NASA ADS] [CrossRef] [Google Scholar]
- Alata, I., Cruz-Diaz, G. A., Muñoz Caro, G. M., & Dartois, E. 2014, A&A, 569, A119 [NASA ADS] [CrossRef] [EDP Sciences] [Google Scholar]
- Alata, I., Jallat, A., Gavilan, L., et al. 2015, A&A, 584, A123 [NASA ADS] [CrossRef] [EDP Sciences] [Google Scholar]
- Brünken, S., Sipilä, O., Chambers, E. T., et al. 2014, Nature, 516, 219 [NASA ADS] [CrossRef] [PubMed] [Google Scholar]
- Cernicharo, J., Gottlieb, C. A., Guelin, M., et al. 1991, ApJ, 368, L39 [NASA ADS] [CrossRef] [Google Scholar]
- Cernicharo, J., Cox, P., Fossé, D., & Güsten, R. 1999, A&A, 351, 341 [NASA ADS] [Google Scholar]
- Chabot, M., Béroff, K., Gratier, P., Jallat, A., & Wakelam, V. 2013, ApJ, 771, 90 [NASA ADS] [CrossRef] [Google Scholar]
- Cuadrado, S., Goicoechea, J. R., Pilleri, P., et al. 2015, A&A, 575, A82 [NASA ADS] [CrossRef] [EDP Sciences] [Google Scholar]
- Duley, W. W., Zaidi, A., Wesolowski, M. J., & Kuzmin, S. 2015, MNRAS, 447, 1242 [NASA ADS] [CrossRef] [Google Scholar]
- Fossé, D., Cernicharo, J., Gerin, M., & Cox, P. 2001, ApJ, 552, 168 [NASA ADS] [CrossRef] [Google Scholar]
- Ikuta, S. 1997, J. Chem. Phys., 106, 4536 [NASA ADS] [CrossRef] [Google Scholar]
- Kawaguchi, K., Kaifu, N., Ohishi, M., et al. 1991, PASJ, 43, 607 [NASA ADS] [Google Scholar]
- Keto, E., & Caselli, P. 2010, MNRAS, 402, 1625 [NASA ADS] [CrossRef] [Google Scholar]
- Keto, E., Rawlings, J., & Caselli, P. 2014, MNRAS, 440, 2616 [NASA ADS] [CrossRef] [Google Scholar]
- Kulczak-Jastrzȩbska, M., Lis, D., & Gerin, M. 2012, Acta Astron., 62, 313 [NASA ADS] [Google Scholar]
- Liszt, H., Sonnentrucker, P., Cordiner, M., & Gerin, M. 2012, ApJ, 753, L28 [NASA ADS] [CrossRef] [Google Scholar]
- Maluendes, S. A., McLean, A. D., & Herbst, E. 1993, ApJ, 417, 181 [NASA ADS] [CrossRef] [Google Scholar]
- Matthews, H. E., & Irvine, W. M. 1985, ApJ, 298, L61 [NASA ADS] [CrossRef] [Google Scholar]
- Minissale, M., Congiu, E., & Dulieu, F. 2016, A&A, 585, A146 [NASA ADS] [CrossRef] [EDP Sciences] [Google Scholar]
- Pety, J., Gratier, P., Guzmán, V., et al. 2012, A&A, 548, A68 [NASA ADS] [CrossRef] [EDP Sciences] [Google Scholar]
- Sakai, N., & Yamamoto, S. 2013, Chem. Rev., 113, 8981 [CrossRef] [Google Scholar]
- Sipilä, O., Caselli, P., & Harju, J. 2015a, A&A, 578, A55 [NASA ADS] [CrossRef] [EDP Sciences] [Google Scholar]
- Sipilä, O., Harju, J., Caselli, P., & Schlemmer, S. 2015b, A&A, 581, A122 [NASA ADS] [CrossRef] [EDP Sciences] [Google Scholar]
- Spezzano, S., Gupta, H., Brünken, S., et al. 2016, A&A, 586, A110 [NASA ADS] [CrossRef] [EDP Sciences] [Google Scholar]
- Talbi, D., Hickman, A. P., Kashinski, D., Malenda, R. F., & Redondo, P. 2009, J. Phys. Conf. Ser., 192, 012014 [NASA ADS] [CrossRef] [Google Scholar]
- Teyssier, D., Hily-Blant, P., Gerin, M., et al. 2005, in ESA SP 577, ed. A. Wilson, 423 [Google Scholar]
- Turner, B. E., Herbst, E., & Terzieva, R. 2000, ApJS, 126, 427 [NASA ADS] [CrossRef] [Google Scholar]
- Vrtilek, J. M., Gottlieb, A., Gottlieb, E. W., Killian, T. C., & Thaddeus, P. 1990, ApJ, 364, L53 [NASA ADS] [CrossRef] [Google Scholar]
- Wakelam, V., Loison, J.-C., Herbst, E., et al. 2015, ApJS, 217, 20 [NASA ADS] [CrossRef] [Google Scholar]
- Wu, Q., Cheng, Q., Yamaguchi, Y., Li, Q., & Schaefer, H. F. 2010, J. Chem. Phys., 132, 044308 [NASA ADS] [CrossRef] [Google Scholar]
Appendix A: Additional data
As noted in the introduction, the C3H2c/l ratio tends to increase with increasing AV. Table A.1 reports the values of the c/l ratio observed in several media. The values range from 3 in diffuse clouds to over 50 in dense cores. However, the density of the medium is not the only quantity that has an effect on this ratio. Teyssier et al. (2005) showed that inside the Horsehead Nebula PDR the C3H2c/l ratio does not exceed 15 even though the extinction is on the order of 10−20, which is comparable with what is found in TMC-1(CP), where the c/l ratio has been observed to be 25 (Turner et al. 2000). In the Orion Bar a c/l ratio of 34 has been recently observed (Cuadrado et al. 2015), which is higher than the value of ~4 observed toward the Horsehead PDR (Teyssier et al. 2005). Furthermore, the c/l ratio is also different among dense cores, ranging from 25 in TMC-1(CP) to 67 in TMC-1C (Spezzano et al. 2016).
Observed C3H2c/l ratios toward various objects, and the associated physical conditions (visual extinction AV, medium density n, (rotational) temperature T) when available in the literature.
All Tables
Modified branching ratios for (c/l)- based on the (c/l)- data from Chabot et al. (2013) (labeled mod_ch), and an ad hoc approach (mod_hr; “hr” stands for “high ratio”).
Observed C3H2c/l ratios toward various objects, and the associated physical conditions (visual extinction AV, medium density n, (rotational) temperature T) when available in the literature.
All Figures
|
Fig. 1 Left panel: abundances of c-C3H2 (solid lines) and l-C3H2 (dotted lines) as functions of distance from the core center in the L1544 model at t = 105 yr. Middle panel: C3H2c/l ratio as a function of distance from the core center in the L1544 model at t = 105 yr. Right panel: density (green solid line), dust temperature (red solid line), and gas temperature (red dashed line) as functions of distance from the core center in the L1544 model of Keto et al. (2014). The different colors in the left and middle panels correspond to |
| In the text | |
|
Fig. 2 Column densities (convolved to a 30′′ beam) of c-C3H2 (left panel) and l-C3H2 (middle panel), and the C3H2c/l column density ratio (right panel) as functions of time toward the center of the L1544 model. The different colors correspond to |
| In the text | |
Current usage metrics show cumulative count of Article Views (full-text article views including HTML views, PDF and ePub downloads, according to the available data) and Abstracts Views on Vision4Press platform.
Data correspond to usage on the plateform after 2015. The current usage metrics is available 48-96 hours after online publication and is updated daily on week days.
Initial download of the metrics may take a while.