Fig. 5
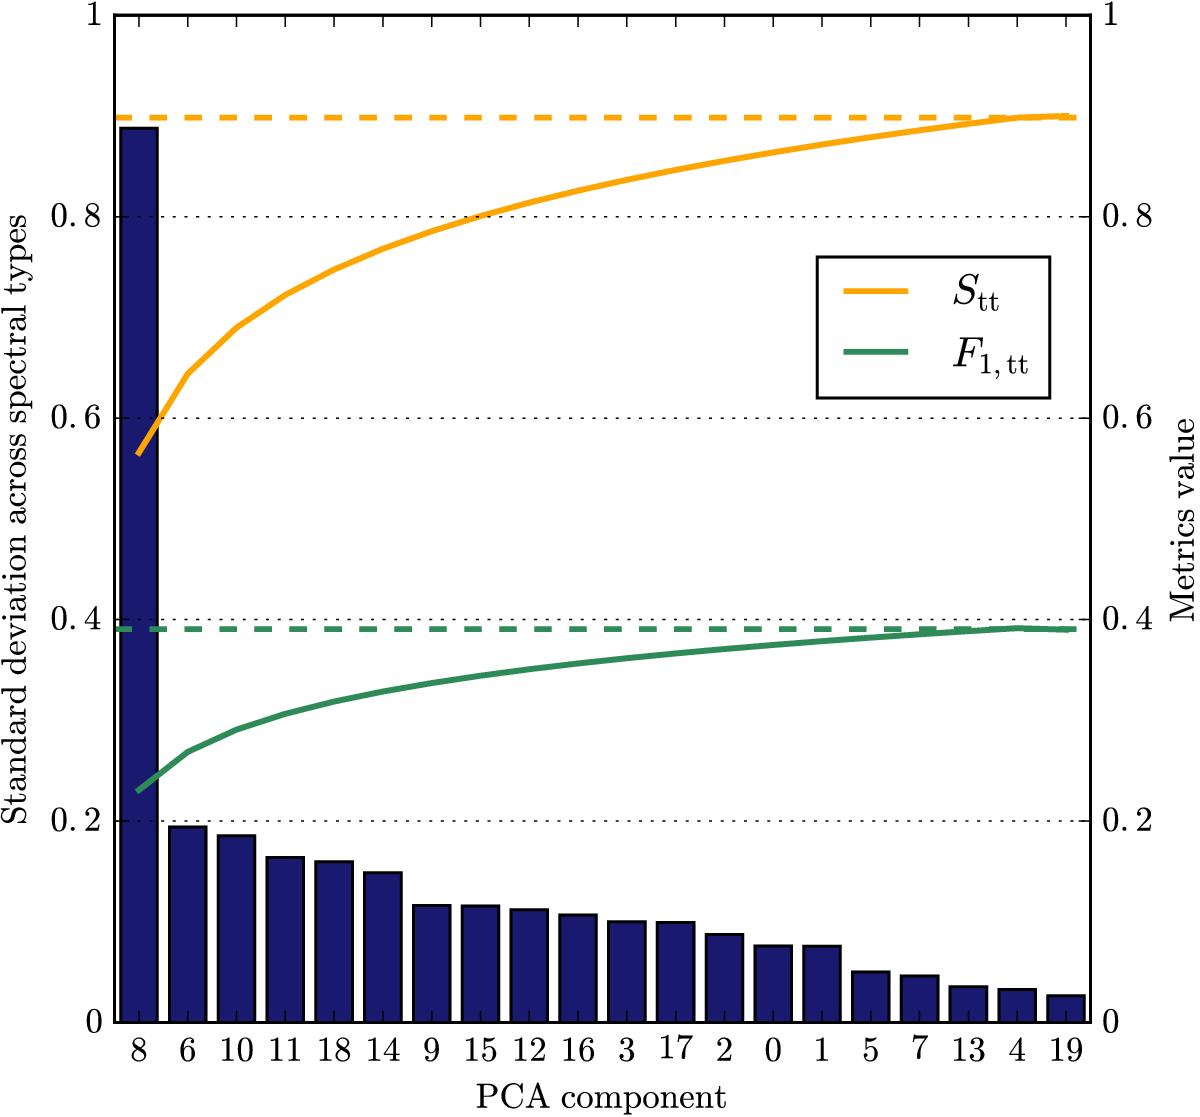
Performance of the classifier with the most significant PCA components and significance of the PCA components. The bar chart shows the standard deviation in the distribution of the first 20 PCA components across the spectral classes in decreasing importance in the context of Euclid simulations. The orange and green lines represent the performance metrics S and F1 for classifiers that use only the most “significant” PCA components, as defined in the text, and given leftwards in the bar chart. The dashed lines depict the results of the optimisation.
Current usage metrics show cumulative count of Article Views (full-text article views including HTML views, PDF and ePub downloads, according to the available data) and Abstracts Views on Vision4Press platform.
Data correspond to usage on the plateform after 2015. The current usage metrics is available 48-96 hours after online publication and is updated daily on week days.
Initial download of the metrics may take a while.