Fig. 3
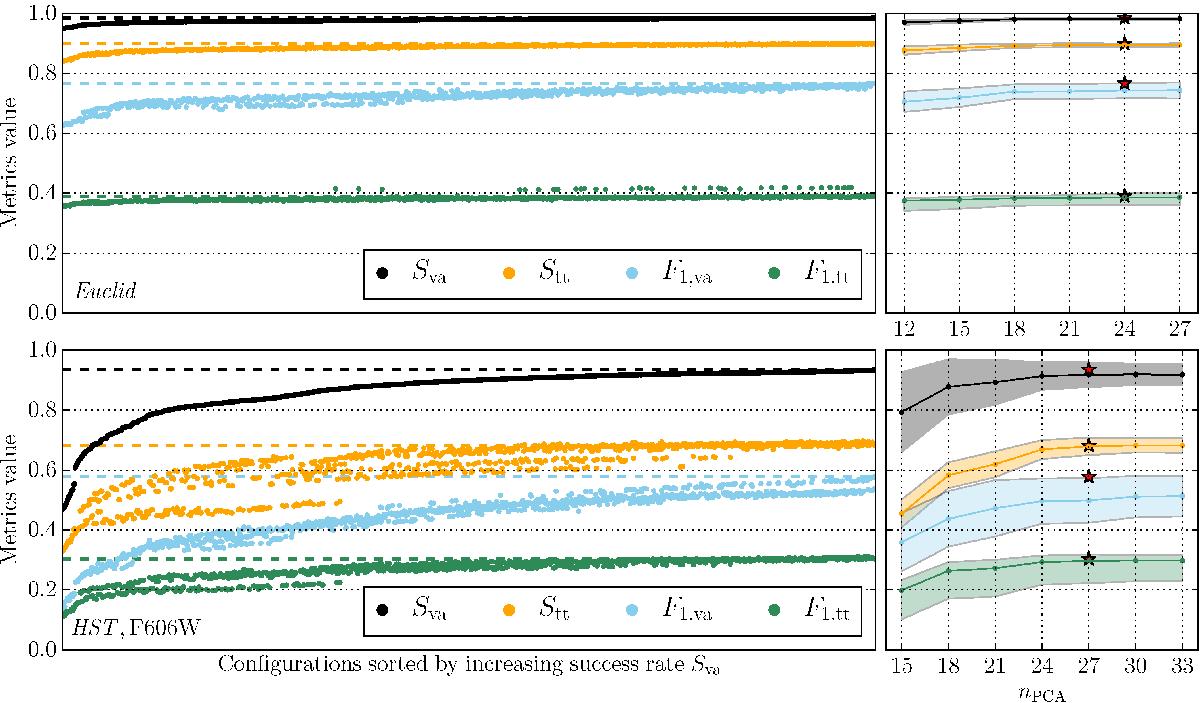
Classification performances achieved by the different hyper-parameter combinations. The top panels are for the Euclid data sets, while the bottom panels are for the HST F606W filter. The left-hand plots show the performance of the all tested configurations in terms of the F1-score and of the success rate S, for the validation (va) and test (tt) sets. The dashed lines show the performance of the best configuration in both cases, selected by the highest Sva score. The right-hand plots depict the median metrics values for configurations with a given number of PCA components. The shaded regions depict the 1σ envelope on the median. The red stars correspond to the optimal classifiers.
Current usage metrics show cumulative count of Article Views (full-text article views including HTML views, PDF and ePub downloads, according to the available data) and Abstracts Views on Vision4Press platform.
Data correspond to usage on the plateform after 2015. The current usage metrics is available 48-96 hours after online publication and is updated daily on week days.
Initial download of the metrics may take a while.