Fig. 1
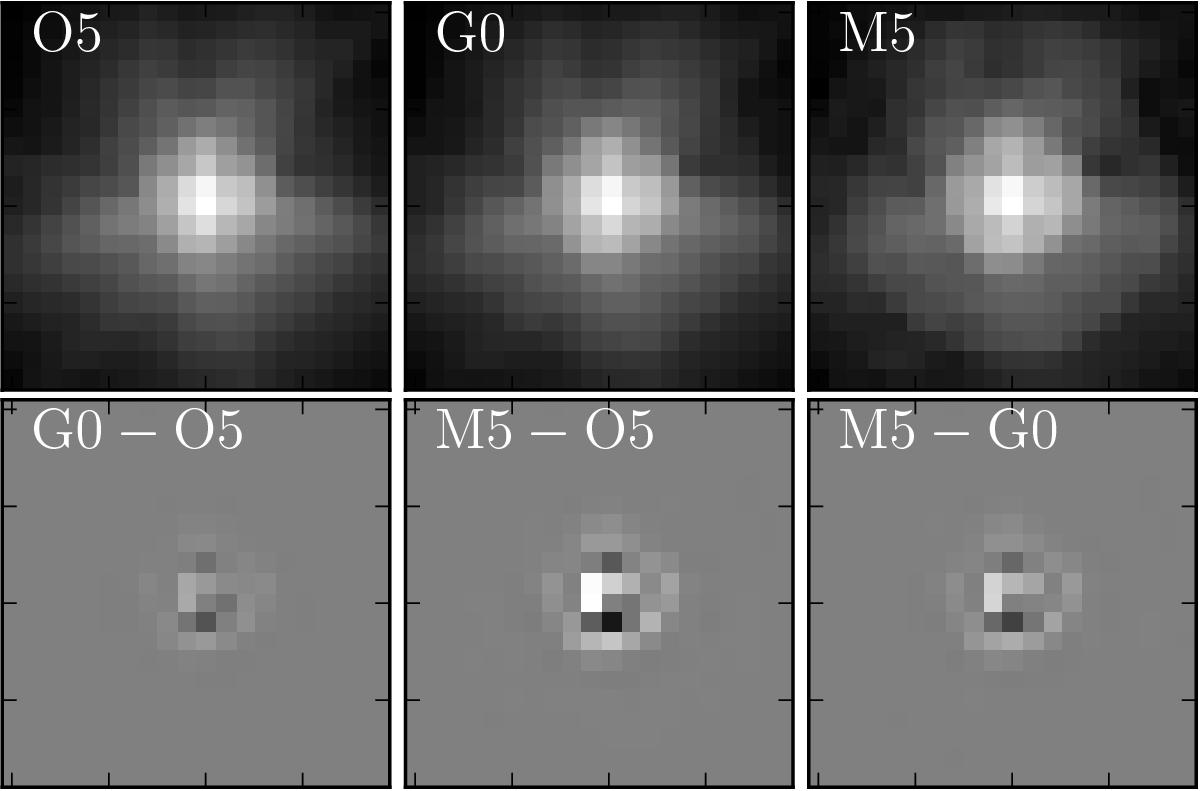
Top: simulated stellar images of different spectral types, as seen by the Euclid VIS imager, shown with a logarithmic flux scale. Bottom: differences between pairs of these images, shown with a linear flux scale. White is positive and black is negative. Note that for demonstration purposes, this illustration is highly idealised: the above stellar images do not contain any noise, and the profiles are centred at exactly the same position with respect to the pixel grid.
Current usage metrics show cumulative count of Article Views (full-text article views including HTML views, PDF and ePub downloads, according to the available data) and Abstracts Views on Vision4Press platform.
Data correspond to usage on the plateform after 2015. The current usage metrics is available 48-96 hours after online publication and is updated daily on week days.
Initial download of the metrics may take a while.