Free Access
Fig. 8
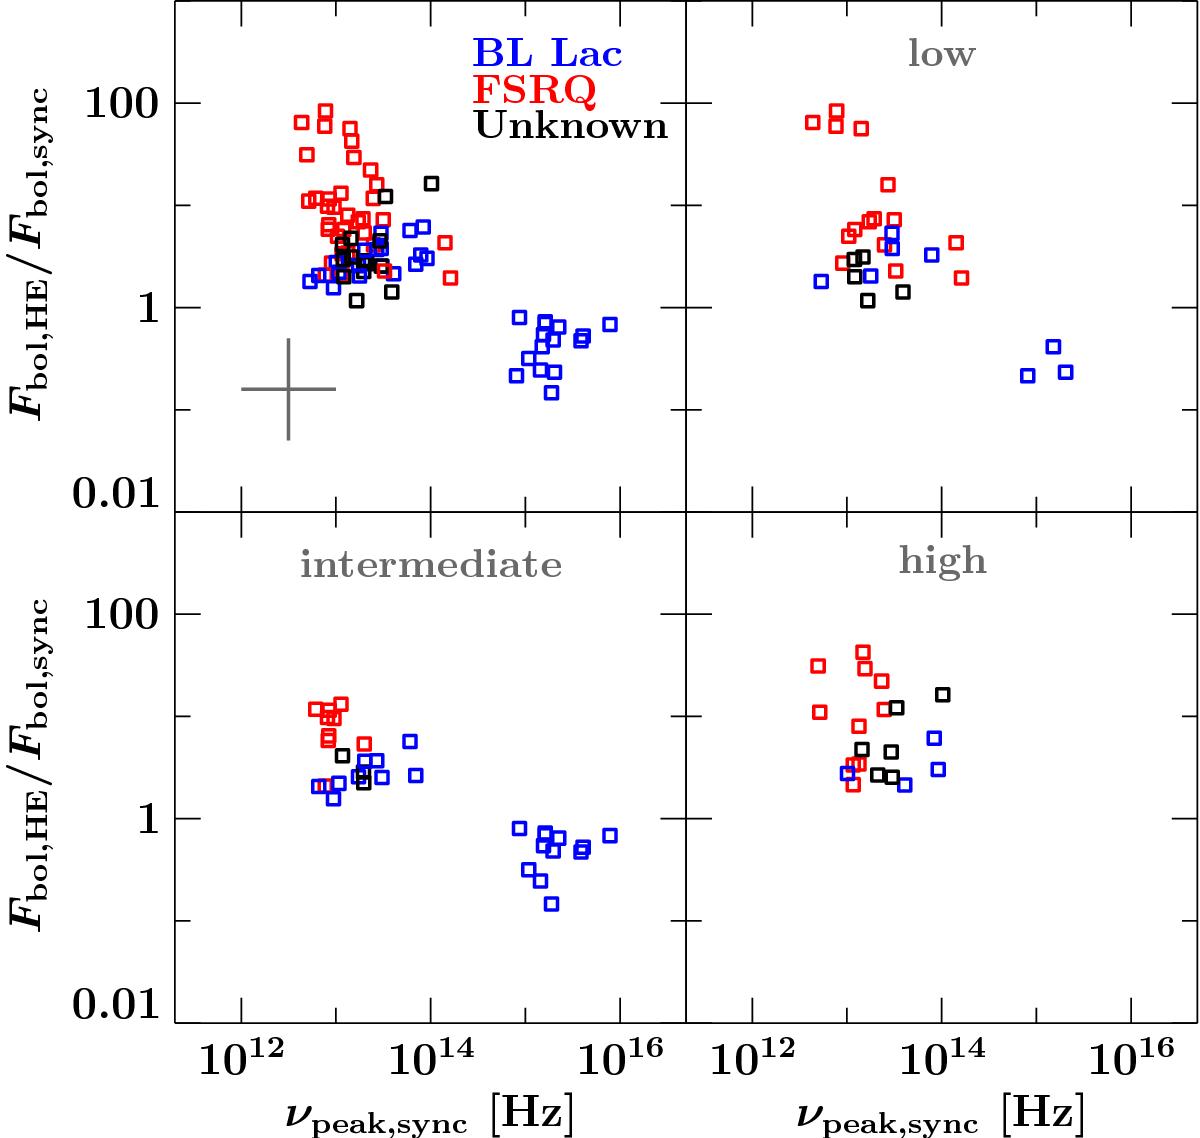
Top left: bolometric Compton dominance for all SEDs for all sources (no k-correction). The blazars’ divide is particularly strong. Top right and bottom: same as above, but SEDs are separated into low, intermediate, and high states. The estimated uncertainty is given in the lower left corner of the top right panel in gray.
Current usage metrics show cumulative count of Article Views (full-text article views including HTML views, PDF and ePub downloads, according to the available data) and Abstracts Views on Vision4Press platform.
Data correspond to usage on the plateform after 2015. The current usage metrics is available 48-96 hours after online publication and is updated daily on week days.
Initial download of the metrics may take a while.