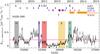
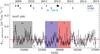
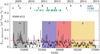
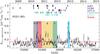
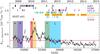
Fig. A.1
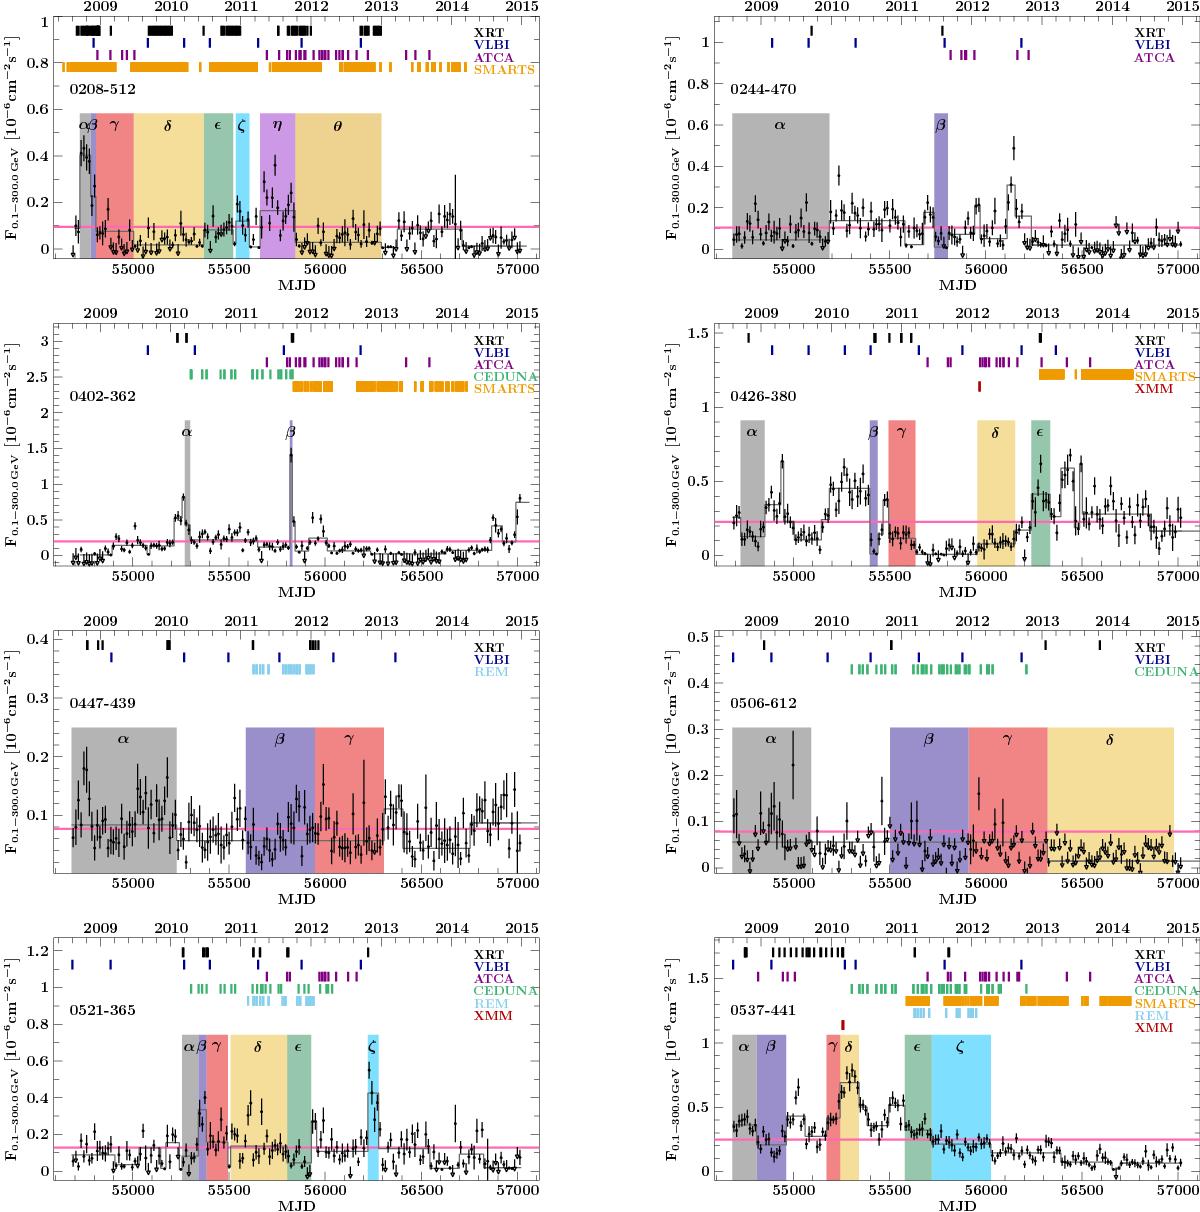
Fermi/LAT light curves for all sources with a known redshift, from August 4, 2008 up to January 1, 2015. A Bayesian blocks analysis was performed on the data and is shown in dark gray. The horizontal pink line shows the average flux over the full light curve. Observations by Swift, XMM-Newton, REM, SMARTS, Ceduna, ATCA, or VLBI are indicated with a line at the corresponding time. Blocks with sufficient data for a broadband SED are shown in color and labeled with Greek letters. The colors correspond to the colors used in the broadband spectra.
Current usage metrics show cumulative count of Article Views (full-text article views including HTML views, PDF and ePub downloads, according to the available data) and Abstracts Views on Vision4Press platform.
Data correspond to usage on the plateform after 2015. The current usage metrics is available 48-96 hours after online publication and is updated daily on week days.
Initial download of the metrics may take a while.