Fig. 9
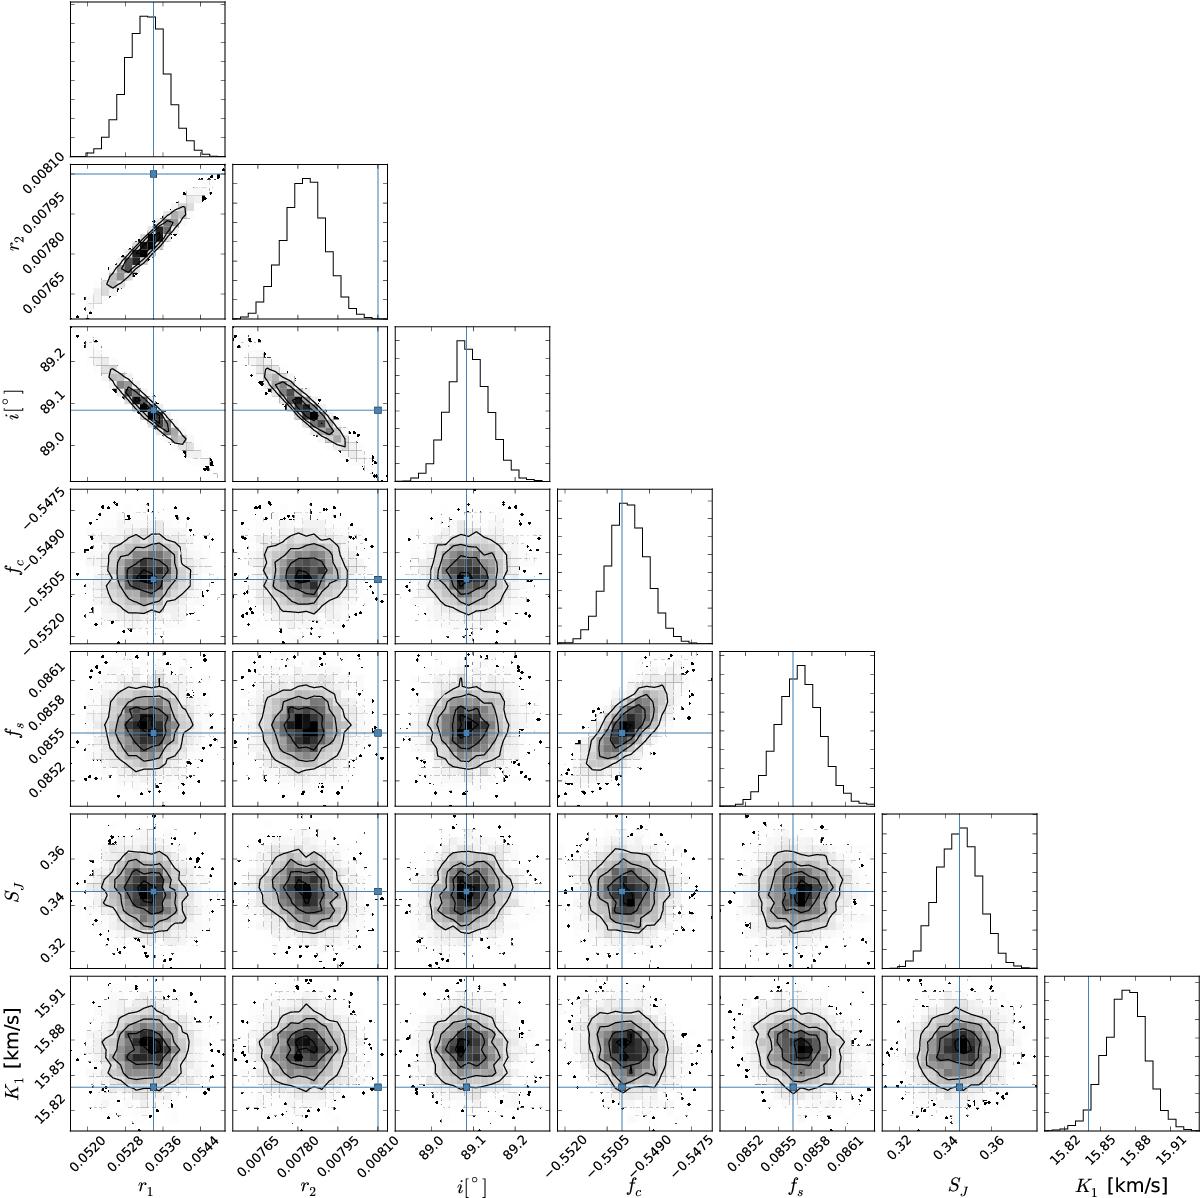
Parameter correlation plots for my fit using ellc to the radial velocity data and light curves of the eclipsing binary J0113+31 from Gómez Maqueo Chew et al. (2014, GMC+2014). The adopted parameter values from GMC+2014 are indicated by lines/points in each panel. The contours in each panel show the 0.5-, 1-, 1.5- and 2-sigma confidence regions for each joint parameter distributions. Points outside the 2-sigma confidence region are individual steps from the emcee MCMC chain.
Current usage metrics show cumulative count of Article Views (full-text article views including HTML views, PDF and ePub downloads, according to the available data) and Abstracts Views on Vision4Press platform.
Data correspond to usage on the plateform after 2015. The current usage metrics is available 48-96 hours after online publication and is updated daily on week days.
Initial download of the metrics may take a while.