Free Access
Fig. 9
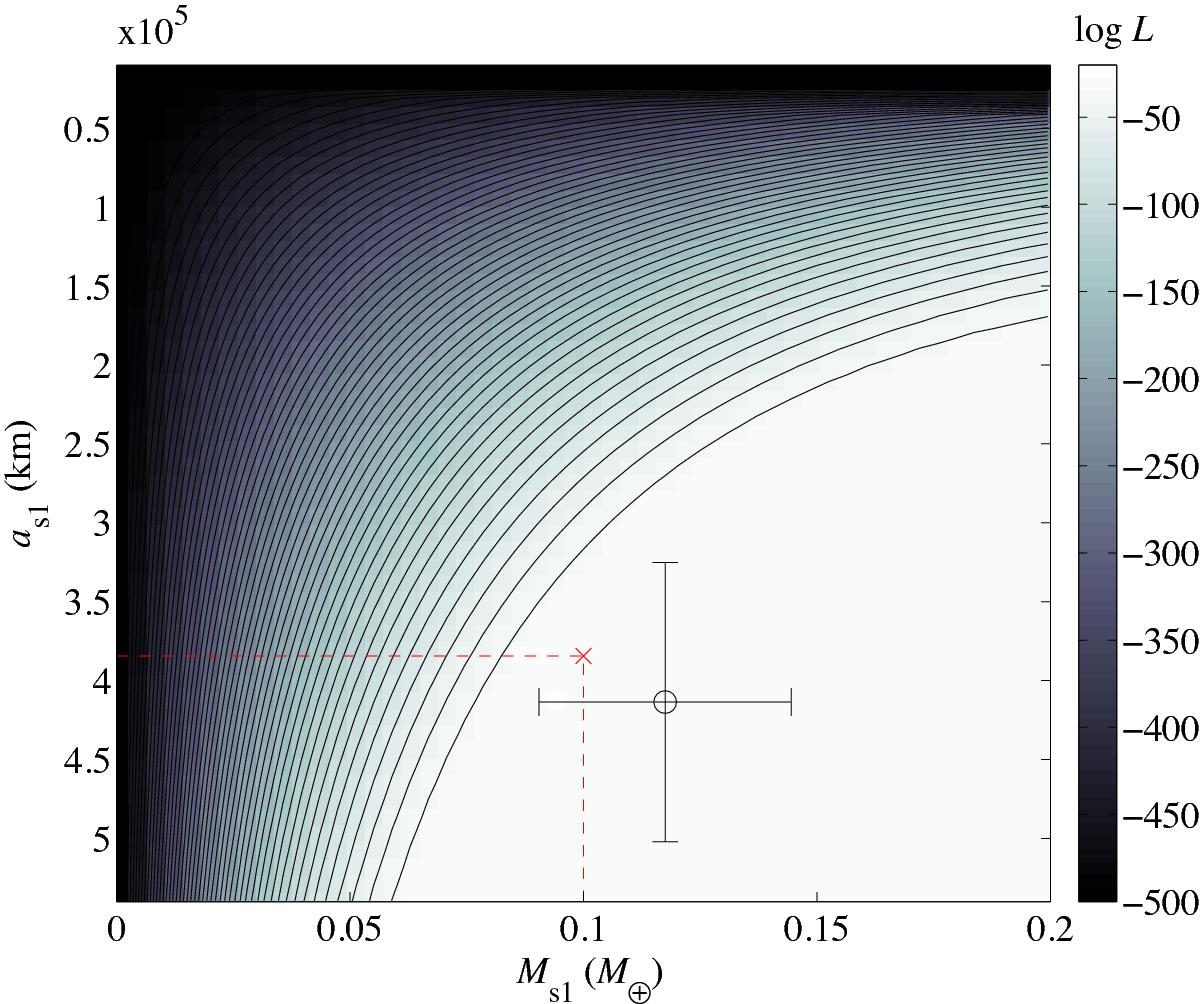
Log-likelihood landscape of the one-moon model applied to the simulated one-moon data. Lighter areas indicate regions of high probability and the red cross indicates the true parameter values. One can clearly see a degeneracy between as1 and Ms1 in the form of a curved plateau in the bottom right portion of the plot.
Current usage metrics show cumulative count of Article Views (full-text article views including HTML views, PDF and ePub downloads, according to the available data) and Abstracts Views on Vision4Press platform.
Data correspond to usage on the plateform after 2015. The current usage metrics is available 48-96 hours after online publication and is updated daily on week days.
Initial download of the metrics may take a while.