Fig. 10
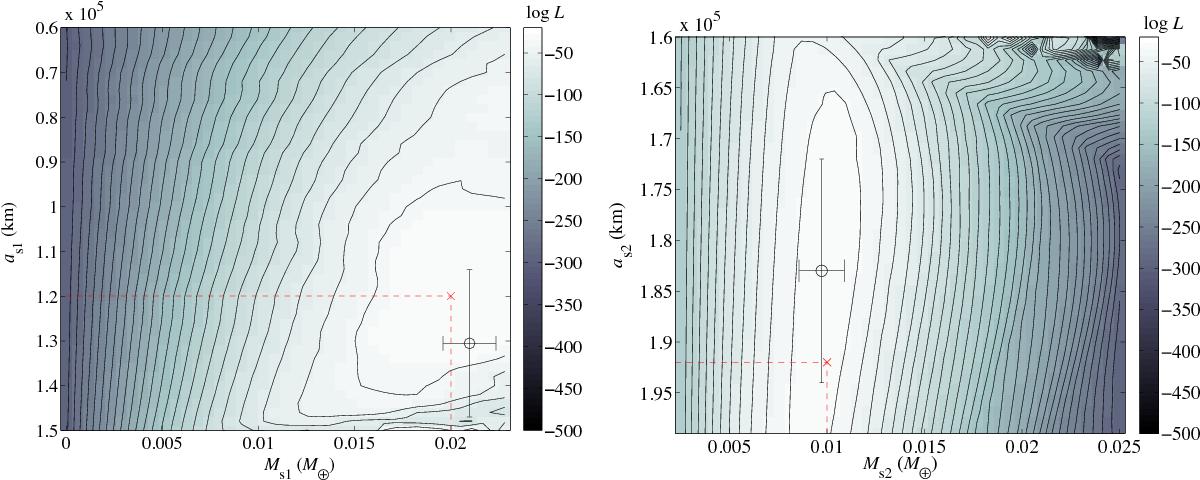
Log-likelihood landscape of the two-moon model applied to simulated two-moon data. Lighter areas indicate regions of better fits. The red cross indicates the location of the simulated system to be retrieved. The parameters corresponding to the inner moon are shown in the left panel and those of the outer moon are shown in the right panel. The vertical ridge of high log-likelihood in the right panel indicates that the orbital distance of the outer moon (as2) is not as well constrained as that of the inner moon.
Current usage metrics show cumulative count of Article Views (full-text article views including HTML views, PDF and ePub downloads, according to the available data) and Abstracts Views on Vision4Press platform.
Data correspond to usage on the plateform after 2015. The current usage metrics is available 48-96 hours after online publication and is updated daily on week days.
Initial download of the metrics may take a while.