Free Access
Fig. 4
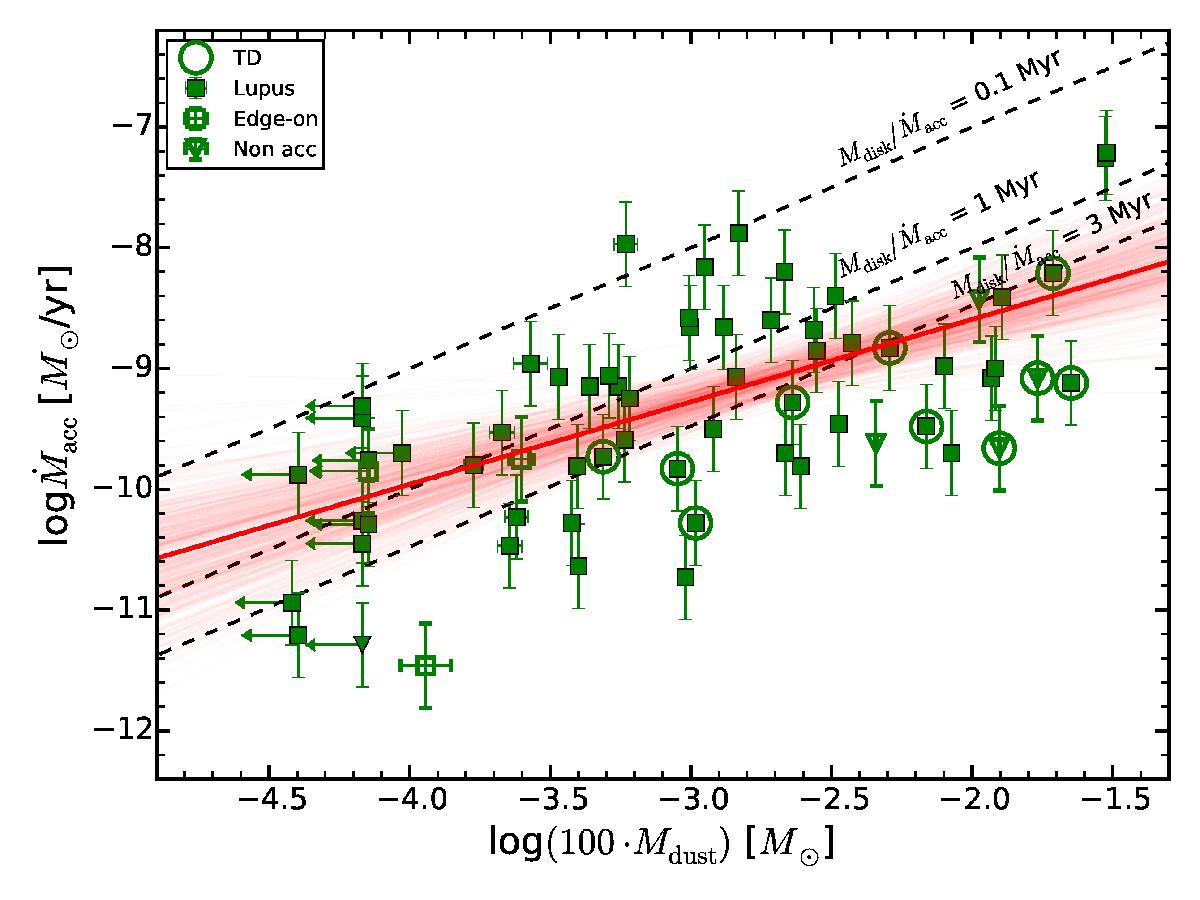
Logarithm of Ṁacc vs. logarithm of Mdisk= 100 ·Mdisk,dust. Symbols are as in Fig. 1. Also here, the best fit with the procedure by Kelly (2007) overlaps with the least-squares best fit. The dashed lines represent different ratios of Mdisk/Ṁacc, as labeled.
Current usage metrics show cumulative count of Article Views (full-text article views including HTML views, PDF and ePub downloads, according to the available data) and Abstracts Views on Vision4Press platform.
Data correspond to usage on the plateform after 2015. The current usage metrics is available 48-96 hours after online publication and is updated daily on week days.
Initial download of the metrics may take a while.