| Issue |
A&A
Volume 591, July 2016
|
|
|---|---|---|
| Article Number | A20 | |
| Number of page(s) | 7 | |
| Section | Interstellar and circumstellar matter | |
| DOI | https://doi.org/10.1051/0004-6361/201628482 | |
| Published online | 06 June 2016 | |
On the nature of absorption features toward nearby stars ⋆
Hamburger Sternwarte, Universität Hamburg, Gojenbergweg 112, 21029 Hamburg, Germany
e-mail: skohl@hs.uni-hamburg.de
Received: 10 March 2016
Accepted: 6 April 2016
Context. Diffuse interstellar absorption bands (DIBs) of largely unknown chemical origin are regularly observed primarily in distant early-type stars. More recently, detections in nearby late-type stars have also been claimed. These stars’ spectra are dominated by stellar absorption lines. Specifically, strong interstellar atomic and DIB absorption has been reported in τ Boo.
Aims. We test these claims by studying the strength of interstellar absorption in high-resolution TIGRE spectra of the nearby stars τ Boo, HD 33608, and α CrB.
Methods. We focus our analysis on a strong DIB located at 5780.61 Å and on the absorption of interstellar Na. First, we carry out a differential analysis by comparing the spectra of the highly similar F-stars, τ Boo and HD 33608, whose light, however, samples different lines of sight. To obtain absolute values for the DIB absorption, we compare the observed spectra of τ Boo, HD 33608, and α CrB to PHOENIX models and carry out basic spectral modeling based on Voigt line profiles.
Results. The intercomparison between τ Boo and HD 33608 reveals that the difference in the line depth is 6.85 ± 1.48 mÅ at the DIB location which is, however, unlikely to be caused by DIB absorption. The comparison between PHOENIX models and observed spectra yields an upper limit of 34.0 ± 0.3 mÅ for any additional interstellar absorption in τ Boo; similar results are obtained for HD 33608 and α CrB. For all objects we derive unrealistically large values for the radial velocity of any presumed interstellar clouds. In τ Boo we find Na D absorption with an equivalent width of 0.65 ± 0.07 mÅ and 2.3 ± 0.1 mÅ in the D2 and D1 lines. For the other Na, absorption of the same magnitude could only be detected in the D2 line. Our comparisons between model and data show that the interstellar absorption toward τ Boo is not abnormally high.
Conclusions. We find no significant DIB absorption in any of our target stars. Any differences between modeled and observed spectra are instead attributable to inaccuracies in the stellar atmospheric modeling than to DIB absorption.
Key words: ISM: general / stars: late-type / local insterstellar matter / ISM: lines and bands / solar neighborhood / stars: atmospheres
The spectra are available at the CDS via anonymous ftp to cdsarc.u-strasbg.fr (130.79.128.5) or via http://cdsarc.u-strasbg.fr/viz-bin/qcat?J/A+A/591/A20
© ESO, 2016
1. Introduction
For a long time, early-type binaries at large distances have been known to show peculiar absorption bands in their spectra. These bands cannot be attributed to stellar lines because they do not follow the Doppler shift caused by the radial motion of the binary components (Merrill 1936). Later, similar absorption bands have also been found in several hundred single stars (Duke 1951). Today, these absorption features are known as diffuse interstellar bands (DIB), which show widths typically ranging from a few mÅ up to several Å. It is assumed that the DIBs are a superposition of different components. The nature of the absorbing material is still under debate for most DIBs (Cami & Cox 2014). However, recently it has been confirmed that three DIBs can be assigned to the absorption spectrum of fullerenes (Campbell et al. 2015). There is consensus that the diffuse bands are of interstellar nature and thus the strength of individual bands depends on the chemical environment along the line of sight, implying a dependence on the stellar distance and the direction of the line of sight (e.g., Hobbs et al. 2008).
Diffuse interstellar bands are most easily observed in bright and distant objects that have few intrinsic spectral lines such as early-type supergiants, for which the equivalent widths of interstellar absorption features have been extensively studied (Herbig 1995). More recently, Hobbs et al. (2009) presented a detailed characterization of the DIB properties in the early-type supergiant HD 183143. One of the DIBs with the highest equivalent width is located at 5780.61 Å and, in the specific case of HD 183143, its shape can be modeled adequately by a single Gaussian function with a full-width at half maximum of 2.14 Å (Hobbs et al. 2009).
In late-type stars DIBs are more challenging to detect because stellar and interstellar lines are blended. Therefore DIB studies inside our Galaxy remain largely restricted to giants at large distance and high column densities of interstellar matter. Comprehensive surveys have been carried out for DIBs that are narrow and have large equivalent widths. Based on several thousand spectra, three-dimensional maps showing the distribution of the interstellar medium have been produced, e.g., using the DIBs at 6614 Å (Puspitarini et al. 2015), 8620 Å (Kos et al. 2013) and 15 272 Å (Zasowski et al. 2015). These maps typically cover distances from a few hundred parsec up to several kilo-parsec and show that the strength of the DIB absorption generally rises with distance. Moreover, Friedman et al. (2011) show that for various DIBs interstellar extinction and hydrogen absorption are correlated.
In addition to DIBs, sharp interstellar atomic absorption lines can be found. Garcia (1991) gives a compilation of the strength of interstellar atomic Na and Ca lines in various stellar spectra. These lines are typically much narrower than the stellar lines because they are not affected by the usual stellar line broadening mechanisms. Like DIBs they are most easily detected in distant early-type stars.
Until recently, surveys targeting the local interstellar medium were restricted to early-type stars. Lallement et al. (2003) mapped the equivalent width of the interstellar Na D lines along different lines of sight. For stars within 70 pc, the authors find no interstellar D2 absorption line stronger than 75 mÅ, respectively, 60 mÅ for the D1 line. Similar studies have also been carried out for the DIBs at 5780 Å and 6284 Å by Raimond et al. (2012). Out of the 24 objects in their sample with distances below 200 pc, only two show an equivalent width larger than 100 mÅ in the DIB at 5780 Å.
Studies of DIBs in late-type stars are not only hampered by ubiquitous stellar line blends and the notorious weakness of the DIBs in the spectra of nearby stars, but also by the presence of telluric lines. This is important because inaccuracies in the telluric correction contaminate the spectral signatures of the DIBs. Using the intermediate dispersion spectrograph (IDS) with a spectral resolution of ~2000 mounted at the 2.5 m Isaac Newton Telescope, Farhang et al. (2015) carried out a search for Na absorption features and DIBs in nearby late-type stars. These authors studied absorption features located at 5780, 5896, and 5890 Å and conclude that DIBs and interstellar Na can indeed be distinguished in the spectra of a number of nearby late-type stars. Farhang et al. (2015) specifically investigated the nearby star τ Boo, a triple system whose primary component hosts a planet; the stellar parameters of τ Boo are listed in Table 1. As a result of their analysis, Farhang et al. (2015) claim that τ Boo shows abnormally high interstellar absorption, and derived substantial equivalent widths for the various DIBs, viz., 137.08 ± 16.61 mÅ for the DIB at 5780 Å, and 407.16 ± 32.95 mÅ and 344.03 ± 32.62 mÅ for the equivalent widths of the interstellar Na D2 and D1 lines.
These equivalent widths are surprisingly large and therefore we decided to examine high-resolution spectra of τ Boo and other, similar objects. With these spectra we are in a position to revise the strength of the interstellar absorption and thus the outline of the paper is as follows: in Sect. 2.1, we present our stellar sample and summarize the stellar parameters and present our approach to correct for telluric lines in Sect. 2.2. Subsequently, we compare the spectrum of τ Boo to the spectrum of the highly similar star, HD 33608, in Sect. 2.3 and compare PHOENIX models to observed data around the location of the DIB at 5780 Å and the Na D lines in Sects. 2.4 and 2.5. We present the same analysis for the A star, α CrB, in Sects. 2.6 and summarize our findings and conclusions in Sect. 3.
List of observed objects.
2. Observations and data analysis
Our analysis is based on TIGRE spectra. TIGRE is a 1.2 m robotic telescope, located in central Mexico and equipped with an echelle spectrograph with a nominal resolution of 20 000; for further details about the instrument and telescope we refer to Schmitt et al. (2014). The raw data was reduced with the TIGRE reduction pipeline in version 2, which is based on the REDUCE package described in detail by Piskunov & Valenti (2002).
All spectra were first corrected for telluric absorption, as described in Sect. 2.2. Then, the wavelength scale was converted to a uniform reference frame to account for systematic stellar radial motion and the barycentric motion of the Earth.
2.1. The stellar sample
We used TIGRE observations of the F-type stars τ Boo and HD 33608, as well as the binary system, α CrB. τ Boo is a triple system consisting of an F-type primary, a nearby M dwarf in a long-period orbit (distance: 1.8′′ in 2012), and a distant L-type companion, whose distance was 42.6′′ in 1998 (Mason et al. 2001). In principle, the spectrum of the M dwarf contaminates the primary spectrum. However, this contamination was neglected because the brightness ratio between the two stars is approximately 10-3 in the wavelength regions of interest.
Furthermore, the primary component also hosts a planet with a velocity semiamplitude of 466.4 m/s (Brogi et al. 2012), which corresponds to a wavelength shift of ± 9.2 mÅ. Since this shift is much smaller than the width of the spectral features, it only weakly affects their shape when spectra of different epochs are averaged.
HD 33608 is very similar to the primary of the τ Boo system. In contrast to τ Boo, it is neither a member of a multiple system, nor does it host any (known) substellar companions. For this reason we chose it to validate the results obtained for τ Boo. Since τ Boo and HD 33608 have very similar stellar parameters, their intrinsic spectra are expected to be almost identical. If interstellar absorption is different toward τ Boo and HD 33608, an inter-comparison of their stellar spectra ought to reveal differences in interstellar absorption, as described in Sect. 2.3.
α CrB is a spectroscopic binary composed of an A1IV and a G5 component (Tomkin & Popper 1986). The primary is both an early-type star and a fast rotator, thus stellar lines are comparatively broad and shallow. To avoid any confusion between stellar lines of the secondary and interstellar features, a spectrum was chosen that was taken during the secondary eclipse. This avoids confusion between the stellar and interstellar Na D lines.
In total, 25 spectra of these objects were taken in the first half of 2015. Details about the objects and observations are summarized in Table 1. Most stellar parameter values were taken from the compilations of Głȩbocki & Gnaciński (2005) and Soubiran et al. (2010). When several values were listed for a stellar parameter, we averaged all given values, but discarded outliers. The typical spread in the listed values is smaller than 5%. As expected, the different values for the metallicity differ by up to 0.08 dex (≈20%), although outliers had already been removed. We note that the spread is generally much larger than the cited error bars, in case errors are given at all. The adopted values as well as the typical spread in the individual values (if applicable) are also listed in Table 1.
2.2. Telluric absorption correction
We corrected each raw spectrum individually for telluric absorption features using the molecfit code (Smette et al. 2015; Kausch et al. 2015). The molecfit software package creates a synthetic transmission spectrum of the Earth’s atmosphere, taking into account the local temperature and humidity profiles that are delivered at a cadence of three hours by weather satellites1. We use this model transmission spectrum to correct the raw stellar spectrum.
In Figs. 1 and 2, we present an example to show the effect of the telluric line correction on the spectrum of α CrB. Before the correction, the shape of the broad stellar Na D lines is completely distorted by the telluric lines, while around 5780 Å the influence of the telluric lines is much smaller, as can be seen in Fig. 2. To quantify the accuracy of the telluric correction, we analyzed TIGRE spectra of α CrB. This object is particularly well suited for this task because it is a fast-rotating early-type star showing shallow, broad spectral lines, which enabled us to distinguish the narrow telluric lines with relative ease.
We tested the telluric correction in the three wavelength ranges 5770−5790 Å, 5880−5910 Å, and 7080−7140 Å. To estimate the accuracy of the correction, we modeled the stellar spectrum by a polynomial and added rotationally-broadened Gaussian absorption lines to represent the Na D lines. In the modeling, we tried out polynomials of varying degrees and found that a second-order polynomial provides satisfactory fits in all the wavelength ranges considered; polynomials of higher order did not improve the fit significantly. We note that in the modeling, we split the wavelength range from 7080 to 7140 Å into two subranges from 7080 to 7116 Å and 7116 to 7140 Å. We then used the resulting fit to normalize the spectrum and calculated the standard deviation to estimate the quality of the telluric correction. Our results are summarized in Table 2.
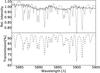 |
Fig. 1 Top panel: uncorrected stellar spectrum of α CrB (grey), corrected stellar spectrum (black). Bottom panel: atmospheric transmission spectrum (dashed). |
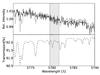 |
Fig. 2 Top panel: uncorrected stellar spectrum of α CrB (grey), corrected stellar spectrum (black). Bottom panel: atmospheric transmission spectrum (dashed). The shaded area denotes the position and FWHM of the putative DIB. |
According to Smette et al. (2015), the depth of an unsaturated telluric line can be modeled with an accuracy that is better than 2%. A comparison with our results shows that the selected wavelength ranges the accuracy is generally consistent or even better than this value.
Deviations between continuum model and data
As a consequence, the corrected stellar spectrum has an additional systematic error component owing to the telluric correction. In contrast to the statistical noise, this error term cannot be suppressed by more observations. The total error budget is on the order of the magnitude of the standard deviation listed in Table 2. The final S/N after telluric correction is about 100 in the wavelength range of the Na D lines and around 300 at 5780 Å.
2.3. Intercomparison of HD 33608 and τ Boo
We compared the spectra of HD 33608 and τ Boo to identify any differences between these two stars. Both stars have very similar values of effective temperature, surface gravity, metallicity, and are fast rotators (see Table 1 for details). However, the stars are located at different lines of sights. The distance to HD 33608 is almost twice the distance of τ Boo, therefore no correlation of the distribution and column depth of interstellar material is expected. This makes it highly unlikely that the strength of interstellar features is identical in the spectra of both objects.
The spectra around 5780 Å are shown in the top panel of Fig. 3; we normalized both spectra independently by adjusting the median flux between 5750 Å and 5810 Å to unity. From Fig. 3, it is clear that the putative DIB is blended by a stellar Fe ii line located at 5780.37 Å and an Fe i line at 5780.60 Å2. In general, we find good agreement between both spectra. We note that none of the spectra has been rotationally broadened. Specifically, both figures show that the stellar lines of τ Boo are slightly deeper than the lines of HD 33608. Plausible explanations for this discrepancy are an increased metallicity in τ Boo and a slower rotation rate of τ Boo, or both.
To examine the differences between the spectrum of HD 33608 and τ Boo, we subtracted both spectra from each other (see lower panel of Fig. 3). Subsequently, we fitted a Gaussian at the expected position of the DIB. A variation in the line centroid was allowed to account for any heliocentric motion of the interstellar gas. According to Welsh et al. (2010), the heliocentric motion is rarely found to be larger than 30 km s-1 in the interstellar medium within 300 pc. For this reason this value was adopted as an upper limit. Furthermore, the line width was allowed to be smaller than 2.14 Å, the value measured in the spectrum of the distant supergiant HD 183143 (Hobbs et al. 2009), which we used as an upper bound. The chemical constituents of the DIBs are unknown and thus the exact intrinsic width of the absorption feature. In case of nearby stars, we expect a lower number of interstellar clouds along the line of sight. Since each cloud has its own heliocentric velocity and chemical composition, one expects a broader absorption feature in the spectra of distant stars, while sharper features may be present in the spectra of closer stars.
Parameters of the best-fitting models.
To quantify the differences in lines without any expected interstellar contributions, we also applied the fitting procedure to the neighboring stellar lines, which ought to be free of DIBs according to Hobbs et al. (2009). In this case, we allowed the central wavelength to vary by ±2 Å and enforced no constraints on the line width or equivalent width. Our results are given in the upper part of Table 3. They show that the feature at 5780 Å is not exceptionally broad, and therefore likely attributable to intrinsic differences between the stellar spectra.
To evaluate whether an additional broad DIB component is present, the fitting procedure was repeated by adding an additional component located at 5780.61 Å with a fixed FWHM of 2.14 Å. The results of this fitting procedure can be found in the lower part of Table 3. A comparison of our fits shows that the results at 5775 and 5785 Å are only marginally affected by this additional component, but the results for the stellar line at 5781 Å differ. In particular, it appears that its equivalent width increased, counterbalancing the influence of the broad component. The equivalent width of the putative DIB component is negative, implying that, if anything, the absorption of the interstellar medium is higher along the line of sight toward HD 33608. However, the presence of any difference in the interstellar absorption is not statistically significant. Depending on the adopted model (with or without additional DIB component) we obtain different values for the difference in the strength of the possible DIB absorption feature. At any rate, our results show that the difference in interstellar absorption must be less than 11.29 mÅ with a confidence of 3σ.
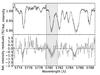 |
Fig. 3 Top panel: comparison between τ Boo (gray) and HD 33608 (black). Bottom panel: comparison of residuals (gray) and best-fitting DIB (black). The shaded area denotes the position and FWHM of the putative DIB. |
2.4. Comparison between data and PHOENIX templates for τ Boo and HD 33608
The method applied in the preceding section is only sensitive to differences in the strength of the interstellar absorption. Following the approach adopted by Farhang et al. (2015), we compared our TIGRE spectra to synthetic stellar models to obtain an absolute value of the equivalent width of interstellar absorption. We specifically compared PHOENIX atmosphere models in the wavelength region between 5750 and 5810 Å to the observed TIGRE spectra. The atmosphere models were rotationally broadened and convolved with the instrumental resolution of TIGRE (R ~ 20 000) and that of the IDS (R ~ 2000) used by Farhang et al. (2015). To disentangle interstellar and stellar features, the synthetic template was subtracted from the stellar spectrum. Differences between the observed and synthetic spectrum can then either be ascribed to inaccuracies in the model or to the actual presence of interstellar matter.
2.4.1. Choosing the template
A precalculated atmospheric model grid can be found in the Göttigen Spectral Library, which provides densely sampled synthetic spectra for a wide range of effective temperatures, surface gravities, and metallicities (Husser et al. 2013). To assess if the model spectra have to be interpolated, the influence of each model parameter on the stellar template was quantified. Furthermore, the influence of the spectrograph’s resolution, R, as well as discrepancies caused by an incorrect radial velocity have been taken into account. We modeled the effect of changing the spectral resolution and the radial velocity on the resulting flux. The spectral resolution of the individual exposures varied slightly between 19 000 and 21 000 from one exposure to the next during the period of data acquisition. For all other parameters, see Table 1 and references therein.
The wavelength-dependent normalized flux for a certain stellar PHOENIX model can be written as F(λ,Teff,...,R), where λ denotes wavelength and the other variables are the required model parameters. For two adjacent parameter values p1 and p2 on the grid we define  with all other model parameters kept fixed. The default values for each parameter, as well as their upper and lower values, are listed in Table 4. The influence of each model parameter has been evaluated over a range that is larger than the scatter listed in Table 1 and the results are listed in Table 4. Between adjacent grid points, the stellar template is most sensitive to metallicity.
Influence of stellar parameters on modeled flux of F-stars.
The effective temperature and surface gravity, as listed in Table 1, were used to choose the best-matching stellar model. Since the quality of the template depends mostly on metallicity, two model spectra with different metallicities were interpolated to obtain a spectrum with a metallicity equal to the mean of the literature values. Since the scatter is substantial, we checked if this metallicity leads to the best model. To that end, the metallicity was varied in steps of 0.0025 between 0.0 and 0.5. For each step an interpolated spectrum was obtained and χ2( [M/H] ) was evaluated. Finally, we determined the best-fit metallicity by searching for ![\hbox{$\min\left(\chi^{2}\left(\rm [M/H]\right)\right)$}](/articles/aa/full_html/2016/07/aa28482-16/aa28482-16-eq39.png) . The associated value was found to be consistent with the literature values to within the error bars.
. The associated value was found to be consistent with the literature values to within the error bars.
2.4.2. Analysis of the residuals
After subtraction of the PHOENIX template, we fitted a Gaussian function that was expected to match the shape of the DIB to the residual spectrum. The width and position of the centroid were taken from Hobbs et al. (2009); these values are valid for HD 183143. Since the interstellar medium toward other objects may have a different radial velocity structure the centroid position was allowed vary. In the modeling, the continuum was approximated by a linear function. The resulting equivalent widths can be found in Table 5 and an example is shown in Fig. 4. Clearly, the depth of the observed spectral line around 5780.6 Å is deeper than the model prediction, suggesting the possible presence of a DIB. However, as can also be seen in Fig. 4, the observed line at 5782 Å is also deeper than the model prediction, although no DIB is known at this position (Hobbs et al. 2009). Furthermore, the pronounced influence of the metallicity on the model spectrum is evident. Apart from metallicity effects the spectra are also affected by inaccuracies of the atomic data used by PHOENIX to generate the models. Both problems contribute to the substantial offset between model and observation and the resulting systematic errors in the fit results.
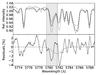 |
Fig. 4 Top panel: comparison between observed spectrum of τ Boo (gray) and PHOENIX models with best-fitting [M/H] (solid black) resp. [M/H] = 0 (dotted black). Bottom panel: differences between best-fitting model and data (solid line). Best-fitting Gaussian (solid line). The shaded area denotes the position and FWHM of the putative DIB. |
For this reason, we emphasize that the results given in Table 5 are not presumed to represent DIB features but rather demonstrate the expected magnitude of systematic inaccuracies arising from the fact that the best-fitting models predominantly lead to radial velocities larger than 30 km s-1 for the DIB component, which is highly unlikely in the solar neighborhood (Welsh et al. 2010).
2.4.3. Analysis at low spectral resolution
To assess the influence of the spectrograph’s resolution on the derived results, the observed spectra were numerically broadened to a resolution of 2000 and the data reduction, as described above, was also applied to these lower resolution spectra. Here, we used the same synthetic templates also adopted in the context of the high-resolution analysis. The results of this analysis are also given in Table 5. With a degraded resolution the resulting equivalent widths are larger by between 20% and up to more than 50% compared to the high-resolution analysis. Again, the radial velocities of the putative DIB components are unrealistically large, with only τ Boo being somewhat of an exception.
Fit results for putative DIB feature.
Fit results for Na D lines.
2.5. Interstellar Na D lines in τ Boo and HD 33608
In addition to the unknown constituents responsible for the DIB absorption, the interstellar space is filled with atomic gas, which manifests itself by sharp absorption lines unique for each chemical element. In the visible wavelength range, strong absorption lines can be found for instance from sodium, with regard to the Na D lines at 5889.95 and 5895.92 Å. In the case of F-type stars, strong stellar lines are also expected at this position. Since τ Boo and HD 33608 are fast rotators, substantial rotational line broadening is present. In contrast, the velocity dispersion in the interstellar Na is expected to be small in the solar neighborhood and thus the absorption line is narrow, which enables the stellar and interstellar contribution to be distinguished.
We approximated the stellar lines by a Voigt profile. The data, together with the best-fitting model, are shown in the upper panels of Fig. 5. Based on these models, we can determine the strength of the stellar Na D lines. While visual inspection of the residuals shown in the lower panels of Fig. 5 demonstrates good agreement between model and data, there is a W-shaped mismatch between model and data in the region around the D2 line. This type of mismatch indicates that the data deviates systematically from a Voigt profile.
An interstellar component, if present, is expected to only cause a small deviation from the Voigt model. To search for possible interstellar lines, we searched the residuals for the largest visible structure whose width is compatible with an instrumentally broadened interstellar line. This width is solely determined by the instrumental line profile for which we assumed a Gaussian with a FWHM of 0.29 Å. Furthermore, it is assumed that all residuals pertaining to the potential interstellar feature are negative. In the lower panels of Fig. 5, we show that the agreement between model and data is better in the region around the D2 line; in this region the residuals do not exceed 0.5%. In contrast, around the D1 line the residuals can be as large as 1.6%. Furthermore, the D2 line is more symmetric than the D1 line. An inspection of PHOENIX models shows that the D1 line is more strongly contaminated by other weak stellar lines. For this reason, the feature was first searched in the D2 line and then at the same RV shift in the D1 line. This type of feature was found around 5890 Å, and 5896 Å in the case of τ Boo. The radial velocity of the feature is between 9 km s-1 and –26 km s-1. Inside the Na D2 line, we were always able to locate a feature whereas, in most cases, we could not find it inside the D1 line. We summarize our results in Table 6.
We also carried out an identical examination for HD 33608. First, we identified a potential feature in the D2 line (see Table 6) and then attempted to find a corresponding feature at the same radial velocity shift in the D1 line. However, in the case of HD 33608, we could not identify such feature in the D1 line.
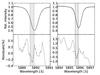 |
Fig. 5 Top panel: comparison between observed spectrum of τ Boo (gray) and best-fitting Voigt profile (black). Left: Na D2 line, right: Na D1 line. Bottom panel: differences between model and data (solid line). Best-fitting Voigt profile (dotted line). The shaded area denotes the position and FWHM of the putative Na D lines. |
2.6. Interstellar absorption in α CrB
For α CrB, we also carried out a search for the DIB at 5780 Å and interstellar Na D absorption by a comparison with PHOENIX template spectra, as described in Sects. 2.4 and 2.5. However, in α CrB we considered it unnecessary to accurately quantify the influence of the stellar parameters on the template because the template only weakly depends on the chosen model, since α CrB is a hot star and a rapid rotator. Since hot stars have weak metallic lines that are, moreover, rotationally broadened, the spectrum of α CrB shows only few distinguishable stellar lines. In addition, the noise of the spectrum is too high to distinguish the small differences (about 2%) in the templates that are caused by the variations in the stellar parameters. The results are also given in Table 5, which indicates that by far the lowest value for the equivalent width is found for α CrB. However, the results for the radial velocity shift of the DIB component in α CrB are unreasonable.
The analysis is similar to that described in Sect. 2.5. The shape of the stellar Na D lines is dominated by the fast stellar rotation. For that reason a rotationally broadened Gaussian was fitted to model the stellar lines instead of a Voigt profile. The results for α CrB can be found in Table 6. In the region of the Na D2 line, we found a small absorption feature at a reasonable wavelength shift. In contrast, inside the stellar D1 line we are not able to confirm the results that are published in literature.
3. Discussion and conclusions
Motivated by the claims of Farhang et al. (2015), who measured the equivalent widths of DIBs in excess of 100 mÅ, we have analyzed high-resolution spectra of the nearby stars α CrB, HD 33608, and τ Boo to search and study possible interstellar absorption in the Na D lines and at a strong DIB at 5780 Å. We applied two methods: as a first step, we carried out an intercomparison of the spectra of HD 33608 and τ Boo for a differential analysis of the two stars. At the putative position of the DIB, we obtain a difference in line depth of 6.85 ± 1.48 mÅ, but also in neighboring regions of the spectra such differences of a few mÅ can be found, which are typically located in the cores of stellar absorption lines. Neither the width of the feature at 5781 Å nor its equivalent width show any peculiarities when compared to a neighboring absorption feature at 5785 Å, although no DIB has been observed by Hobbs et al. (2009) at these locations. The only feature that differs significantly in width and equivalent width is at 5775 Å. To rule out a possible broad and shallow DIB component, we repeated the fitting with an additional component with fixed FWHM and obtained results that are identical within the error bars. We are thus lead to the conclusion that the differences between the spectra can be attributed to intrinsic stellar properties and that the interstellar chemical environment of both objects must be very similar.
As a second step we therefore carried out a closer examination using stellar atmosphere models. The comparison between PHOENIX model and data reveals that the lines at 5780 Å and 5782 Å have been modeled too shallow. The difference in equivalent width is 41.7 mÅ and 34.0 mÅ for the F-stars and 6.4 mÅ for the A-star. If we degrade the resolution to 2000, the equivalent width is 51.2 mÅ and 52.8 mÅ for the F-stars and 8.4 mÅ for the A-star. Furthermore, our approach requires a velocity of the interstellar medium on the order of 35 km s-1.
Both methods show that differences are not only present at the assumed locations of DIBs but also in other regions where no DIBs are known. This leads us to the conclusion that the discrepancies between model and data cannot be ascribed to
interstellar features, but rather to inaccuracies of stellar models in that stellar absorption lines are incorrectly modeled. The reasons for the incorrect modeling can be grouped into two categories: inaccuracies in stellar modeling and incorrect stellar parameters. For instance, the catalog of Soubiran et al. (2010) lists a wide range of metallicities for each object. Depending on what value is adopted, this will affect the stellar model. Inaccuracies in atomic line parameters will affect the shape and depth of a stellar line. Furthermore, the radial velocity of the derived DIB component is fairly high, these values have only been found rarely and are unusual for nearby stars.
Our results are therefore at variance with those by obtained Farhang et al. (2015). Equivalent widths in excess of 100 mÅ are not confirmed with our data. Of course, we cannot rule out the possible presence of DIBs. However, if present, their equivalent widths must be smaller than the inaccuracies of the stellar line modeling and we conclude that the equivalent width of any DIB in the sightline of τ Boo is below 34.9 mÅ with a confidence of 3σ.
Acknowledgments
This research has made use of the SIMBAD database, operated at CDS, Strasbourg, France, of the Washington Double Star Catalog maintained at the US Naval Observatory, of the Exoplanet Orbit Database and the Exoplanet Data Explorer at exoplanets.org, and of the NIST Atomic Spectra Database, maintained at the National Institute of Standards and Technology, Gaithersburg, MD.
References
- Brogi, M., Snellen, I. A. G., de Kok, R. J., et al. 2012, Nature, 486, 502 [NASA ADS] [CrossRef] [PubMed] [Google Scholar]
- Cami, J., & Cox, N. L. J. 2014, in The Diffuse Interstellar Bands, IAU Symp., 297 [Google Scholar]
- Campbell, E. K., Holz, M., Gerlich, D., & Maier, J. P. 2015, Nature, 523, 322 [NASA ADS] [CrossRef] [PubMed] [Google Scholar]
- Duke, D. 1951, ApJ, 113, 100 [NASA ADS] [CrossRef] [Google Scholar]
- Farhang, A., Khosroshahi, H. G., Javadi, A., et al. 2015, ApJ, 800, 64 [NASA ADS] [CrossRef] [Google Scholar]
- Friedman, S. D., York, D. G., McCall, B. J., et al. 2011, ApJ, 727, 33 [NASA ADS] [CrossRef] [Google Scholar]
- Garcia, B. 1991, A&AS, 89, 469 [NASA ADS] [Google Scholar]
- Głȩbocki, R., & Gnaciński, P. 2005, in 13th Cambridge Workshop on Cool Stars, Stellar Systems and the Sun, eds. F. Favata, G. A. J. Hussain, & B. Battrick, ESA SP, 560, 571 [Google Scholar]
- Han, E., Wang, S. X., Wright, J. T., et al. 2014, PASP, 126, 827 [NASA ADS] [CrossRef] [Google Scholar]
- Herbig, G. H. 1995, ARA&A, 33, 19 [NASA ADS] [CrossRef] [Google Scholar]
- Hobbs, L. M., York, D. G., Snow, T. P., et al. 2008, ApJ, 680, 1256 [NASA ADS] [CrossRef] [Google Scholar]
- Hobbs, L. M., York, D. G., Thorburn, J. A., et al. 2009, ApJ, 705, 32 [NASA ADS] [CrossRef] [Google Scholar]
- Husser, T.-O., Wende-von Berg, S., Dreizler, S., et al. 2013, A&A, 553, A6 [NASA ADS] [CrossRef] [EDP Sciences] [Google Scholar]
- Kausch, W., Noll, S., Smette, A., et al. 2015, A&A, 576, A78 [NASA ADS] [CrossRef] [EDP Sciences] [Google Scholar]
- Kos, J., Zwitter, T., Grebel, E. K., et al. 2013, ApJ, 778, 86 [NASA ADS] [CrossRef] [Google Scholar]
- Lallement, R., Welsh, B. Y., Vergely, J. L., Crifo, F., & Sfeir, D. 2003, A&A, 411, 447 [EDP Sciences] [Google Scholar]
- Mason, B. D., Wycoff, G. L., Hartkopf, W. I., Douglass, G. G., & Worley, C. E. 2001, AJ, 122, 3466 [Google Scholar]
- Merrill, P. W. 1936, ApJ, 83, 126 [NASA ADS] [CrossRef] [Google Scholar]
- Piskunov, N. E., & Valenti, J. A. 2002, A&A, 385, 1095 [NASA ADS] [CrossRef] [EDP Sciences] [Google Scholar]
- Puspitarini, L., Lallement, R., Babusiaux, C., et al. 2015, A&A, 573, A35 [NASA ADS] [CrossRef] [EDP Sciences] [Google Scholar]
- Raimond, S., Lallement, R., Vergely, J. L., Babusiaux, C., & Eyer, L. 2012, A&A, 544, A136 [NASA ADS] [CrossRef] [EDP Sciences] [Google Scholar]
- Schmitt, J. H. M. M., Schröder, K.-P., Rauw, G., et al. 2014, Astron. Nachr., 335, 787 [NASA ADS] [CrossRef] [Google Scholar]
- Smette, A., Sana, H., Noll, S., et al. 2015, A&A, 576, A77 [NASA ADS] [CrossRef] [EDP Sciences] [Google Scholar]
- Soubiran, C., Le Campion, J.-F., Cayrel de Strobel, G., & Caillo, A. 2010, A&A, 515, A111 [NASA ADS] [CrossRef] [EDP Sciences] [Google Scholar]
- Tomkin, J., & Popper, D. M. 1986, AJ, 91, 1428 [NASA ADS] [CrossRef] [Google Scholar]
- Welsh, B. Y., Lallement, R., Vergely, J.-L., & Raimond, S. 2010, A&A, 510, A54 [NASA ADS] [CrossRef] [EDP Sciences] [Google Scholar]
- Wenger, M., Ochsenbein, F., Egret, D., et al. 2000, A&AS, 143, 9 [NASA ADS] [CrossRef] [EDP Sciences] [Google Scholar]
- Zasowski, G., Ménard, B., Bizyaev, D., et al. 2015, ApJ, 798, 35 [NASA ADS] [CrossRef] [Google Scholar]
All Tables
All Figures
|
Fig. 1 Top panel: uncorrected stellar spectrum of α CrB (grey), corrected stellar spectrum (black). Bottom panel: atmospheric transmission spectrum (dashed). |
| In the text | |
|
Fig. 2 Top panel: uncorrected stellar spectrum of α CrB (grey), corrected stellar spectrum (black). Bottom panel: atmospheric transmission spectrum (dashed). The shaded area denotes the position and FWHM of the putative DIB. |
| In the text | |
|
Fig. 3 Top panel: comparison between τ Boo (gray) and HD 33608 (black). Bottom panel: comparison of residuals (gray) and best-fitting DIB (black). The shaded area denotes the position and FWHM of the putative DIB. |
| In the text | |
|
Fig. 4 Top panel: comparison between observed spectrum of τ Boo (gray) and PHOENIX models with best-fitting [M/H] (solid black) resp. [M/H] = 0 (dotted black). Bottom panel: differences between best-fitting model and data (solid line). Best-fitting Gaussian (solid line). The shaded area denotes the position and FWHM of the putative DIB. |
| In the text | |
|
Fig. 5 Top panel: comparison between observed spectrum of τ Boo (gray) and best-fitting Voigt profile (black). Left: Na D2 line, right: Na D1 line. Bottom panel: differences between model and data (solid line). Best-fitting Voigt profile (dotted line). The shaded area denotes the position and FWHM of the putative Na D lines. |
| In the text | |
Current usage metrics show cumulative count of Article Views (full-text article views including HTML views, PDF and ePub downloads, according to the available data) and Abstracts Views on Vision4Press platform.
Data correspond to usage on the plateform after 2015. The current usage metrics is available 48-96 hours after online publication and is updated daily on week days.
Initial download of the metrics may take a while.