| Issue |
A&A
Volume 591, July 2016
|
|
|---|---|---|
| Article Number | A23 | |
| Number of page(s) | 10 | |
| Section | Extragalactic astronomy | |
| DOI | https://doi.org/10.1051/0004-6361/201628458 | |
| Published online | 06 June 2016 | |
X-ray polarimetric signatures induced by spectral variability in the framework of the receding torus model
1 Observatoire Astronomique de Strasbourg, Université de Strasbourg, CNRS, UMR 7550, 11 rue de l’Université, 67000 Strasbourg, France
e-mail: This email address is being protected from spambots. You need JavaScript enabled to view it.
2 Université Grenoble Alpes, IPAG, 38000 Grenoble, France
3 CNRS, IPAG, 38000 Grenoble, France
Received: 8 March 2016
Accepted: 26 April 2016
Abstract
Context. Obscuring circumnuclear dust is a well-established constituent of active galactic nuclei (AGN). Traditionally referred to as the receding dusty torus, its inner radius and angular extension should depend on the photo-ionizing luminosity of the central source.
Aims. We quantify the expected time-dependent near-infrared (NIR), optical, ultraviolet (UV) and X-ray polarization of a receding dusty torus as a function of the variable X-ray flux level and spectral shape.
Methods. Using a Monte Carlo approach, we simulate the radiative transfer between the multiple components of an AGN adopting model constraints from the bright Seyfert galaxy NGC 4151. We compare our model results to the observed NIR to UV polarization of the source and predict its X-ray polarization.
Results. We find that the 2−8 keV polarization fraction of a standard AGN model varies from less then a few percent along polar viewing angles up to tens of percent at equatorial inclinations. At viewing angles around the type-1/type-2 transition, there is a different X-ray polarization variability in a static or a receding torus scenario. In the former case, the expected 2−8 keV polarization of NGC 4151 is found to be 1.21% ± 0.34% with a constant polarization position angle, while in the latter scenario it varies from 0.1% to 6% depending on the photon index of the primary radiation. Additionally, an orthogonal rotation of the polarization position angle with photon energy appears for very soft primary spectra.
Conclusions. Future X-ray polarimetry missions will be able to test whether the receding model is valid for Seyfert galaxies seen at a viewing angle close to the torus horizon. The overall stability of the polarization position angle for photon indexes softer than Γ = 1.5 ensures that reliable measurements of X-ray polarization are possible. We derive a long-term observational strategy for NGC 4151 assuming observations with a small to medium-sized X-ray polarimetry satellite.
Key words: galaxies: active / galaxies: Seyfert / galaxies: individual: NGC 4151 / polarization / radiative transfer / X-rays: galaxies
© ESO, 2016
1. Introduction
Equatorial obscuration by an optically thick material that prevents near-infrared (NIR), optical, ultraviolet (UV), and soft X-ray radiation to escape from the subparsec regions of active galactic nuclei (AGN) is a mandatory element in our nowadays understanding of radio-quiet and radio-loud objects. There is evidence of circumnuclear obscuration everywhere. The absence of optical broad lines, produced by Keplerian motion in a disk-like broad line region (BLR) in the spectra of type-2 (edge-on) AGN, only revealed by spectropolarimetry, was unambiguous proof of obscuration (Antonucci & Miller 1985). X-ray observations provided additional confirmation of the presence of a Compton-thick molecular material close to the equatorial plane: soft (<2 keV) X-ray radiation from the power-law component were very much absorbed in type-2 Seyfert galaxies, while hard X-rays were ubiquitously detected for almost all objects (Smith & Done 1996). Their characteristic power-law emission spectrum, similar to that of type-1s but affected by photoelectric absorption cut-offs, showed that a cold molecular medium with a hydrogen column density up to 1024 at/cm2 (and even larger columns inferred for other sources) was indeed located between the source and the observer (Turner et al. 1997).
The unified model, as postulated by Antonucci & Miller (1985), Lawrence (1991), Antonucci (1993), and Urry & Padovani (1995), does not clearly define the morphology of the circumnuclear dust region. Originally treated as a toroidal structure, the advance of space observations reveals a more complex geometry, probably made of small optically thick clouds embedded in a radiation-driven outflow (Elvis 2000; Proga 2007; Dorodnitsyn et al. 2016). However, it was possible to estimate its outer radius (about 100 times) the torus inner radius (Kishimoto et al. 2009) and the very similar spectral energy distributions (SED) of AGN longward of 1μm (Elvis et al. 1994) points toward an inner radius fixed by dust sublimation. The inner radius is determined by the dust sublimation temperature and therefore depends on the luminosity of the photo-ionizing radiation originating in the central accretion disk. This suggestion first appeared in Lawrence (1991), where the concept of a “receding torus” was presented in agreement with observed time delays between different flux levels in the optical and NIR continua (Clavel et al. 1989; Oknyanskij & Horne 2001; Koshida et al. 2009; Kishimoto et al. 2013). Two additional strong arguments in favor of the receding torus scheme were made by Jackson & Browne (1990), Hill et al. (1996), and Willott et al. (2000): the radio-loud quasar fraction among radio-loud AGN increases with increasing emission-line and radio luminosities, and there is a difference in [O iii] line luminosity between radio galaxies and radio-loud quasars at a specific radio power. The same trends are detected in radio-quiet AGN (Steffen et al. 2003; Kishimoto et al. 2013), indicating that the inner radius of the equatorial structure must be influenced by the luminosity of the photo-ionizing source.
The luminosity affects the radius at which dust evaporates or condensates, and it is also expected to affect the half-opening angle of the obscuring torus. Hill et al. (1996) have shown that the 3CR quasar fraction increases with increasing radio luminosity; however, this luminosity-size correlation seemed to be marginally significant at large (z> 0.5) redshifts (Kapahi & Kulkarni 1990). Gopal-Krishna et al. (1996) demonstrated that a wider opening angle with increasing radio luminosity could solve the problem, with the mean half-opening angle growing from about 20° to 60° (with respect to the symmetry axis of the AGN defined by the direction of the radio jet) for objects with an [O iii] line luminosity ranging from 1042 to 1044 erg/s (Arshakian 2005). The fraction of type-2 AGN is thus expected to decrease with photo-ionizing luminosity (Hill et al. 1996), a trend that is confirmed by large samples of AGN observed in the optical (Weymann et al. 1991; Simpson 2005), X-ray (Fiore et al. 1998), and radio bands (Sanders et al. 1989).
However, Willott et al. (2000, 2001) have shown that the luminosity-size correlation and the [O iii] line differences between radio galaxies and radio quasars can also be explained within reasonable margins by a two-population model with a unique torus at a fixed half-opening angle (Grimes et al. 2004). If this explanation is valid, the geometrical variability of a receding torus is not an absolute certitude in all quasar populations, and understanding the evolution of the morphology of the circumnuclear AGN material is crucial in order to assess the unified model. This need is highlighted by the discovery of strong absorption in the soft X-ray spectrum of NGC 5548, a famous Seyfert-1 with an estimated inclination of 30° (Ursini et al. 2015), which contradicts the unified model. Similarly, a new but not well-quantified population of Seyfert-2 galaxies has appeared, showing little or no absorption in the X-ray band, and also a lack of broad optical lines (e.g., Panessa et al. 2009; Bianchi et al. 2012), a picture hardly compatible with an optically thick dusty torus situated close to the AGN equatorial plane.
In this context, it is of a prime importance to investigate equatorial obscuring regions around AGN and to test whether changes in the torus properties can explain the observed particularities mentioned above. Since variations in torus half-opening angle and inner radius with photo-ionizing luminosity are expected to alter the angles at which photons will scatter on the molecular material, a straightforward technique to achieve our goal is to look at the polarimetric signatures resulting from the receding torus model. Hence, this paper aims to translate the different morphologies of the obscuring torus into detectable evidence in order to test the receding torus model. We focus our work on the X-ray polarimetric signatures of an AGN model based on NGC 4151 in order to assess scientific prospects for future X-ray polarimeters. We present the model and the Monte Carlo code used in this paper in Sect. 2, and we exploit the polarimetric results of different realizations of the torus in Sect. 3, with a special focus on NGC 4151 in Sect. 4. We discuss our results in the prism of the different timescales in the inner parsec of our model in Sect. 5 and conclude in Sect. 6.
2. Modeling the receding torus
2.1. Model setup and radiative transfer code
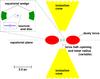 |
Fig. 1 Emission and scattering geometry in our baseline model. The box is a zoom on the central AGN region. The outer radius of the polar outflows (shown in yellow) are truncated to fit the sketch. Sizes and geometries are detailed in Table 1. |
Parametrization of the AGN model.
The model we use in this paper follows the morphological parametrization of the Unification Scheme (Antonucci 1993) and observational constraints on the composition and geometry of NGC 4151. At the center of the model is an optically thick, geometrically thin accretion disk filled with mildly ionized matter. The disk reflects continuum photons originating from two hot plasma regions (coronas) above and below the disk. The coronas emit a power-law spectrum with a spectral flux that depends upon the photon index Γ: according to the known anti-correlation between the photon index and the Eddington ratio in Seyfert galaxies (Gu & Cao 2009), increasing Γ will result in decreasing X-ray fluxes. Along the equatorial plane lies a wedge scattering region that is responsible for the production of polarization parallel to the AGN radio axis at type-1 inclinations, as detected in the UV, optical, and NIR regimes (e.g., Young 2000; Smith et al. 2004). This ring-like disk is filled with electrons and has a small half-opening angle with respect to the equatorial plane. Farther out along the equator is the main obscuring region, an elliptical dusty torus with nH = 1025 at/cm2. We fix its outer radius to 2 pc according to the most recent constraints obtained by Schnülle et al. (2015) on NGC 4151 using dust reverberation techniques. The inner radius of the torus and its half-opening angle (with respect to the polar axis) are left to vary according to the desired X-ray flux or Γ. Finally, along the pole, highly ionized winds carry out momentum and energy in the form of a double-conical region extending up to 400 pc (Das et al. 2005). Its half-opening angle (from the polar axis) is set to 33°, as suggested by Das et al. (2005) based on long-slit spectroscopy and kinematic modeling of NGC 4151. A sketch of our multiple-component model is presented in Fig. 1 and summarized in Table 1.
Radiative transfer will be undertaken by the Monte Carlo code STOKES (Goosmann & Gaskell 2007; Marin et al. 2012, 2015a), a multiple scattering code specifically designed to study the complex environment of Seyfert galaxies. The STOKES code computes the fluxes and polarization of radiation from the NIR to the hard X-ray band taking into account Mie, Thomson and Compton scattering, absorption, re-emission by fluorescent processes, photo-ionization, and recombination effects in a full three-dimensional environment. The Mie approximation breaks down at the X-ray energies considered here and should be replaced by calculations from X-ray diffraction theory (see Draine 2003). This is not implemented in STOKES as the standard procedure for scattering on dust grains using Mueller matrices and Stokes formalism is not yet ready for X-rays (Hoffman & Draine 2016). We therefore do not take dust scattering off of dust grains into account in the X-ray range, but rely only on the scattering component of the neutral reprocessing. So far, this is a rather common procedure in X-ray radiative transfer. Since the dust is optically thick, the polarization should be dominated by (single-)scattering at the surface of the medium, for which the electron scattering is dominant. The latest developments of STOKES, as well as a series of applications, are described in Marin & Goosmann (2014).
2.2. Correlation between fluxes and torus morphology
The receding torus model developed by Simpson (2005) and Arshakian (2005) stipulates that the obscuring fraction of type-1 and type-2 AGN (either radio-quiet or radio-loud) depends on the luminosity of the central engine. In particular, Simpson (2005) has shown that the height of the equatorial dusty torus varies with luminosity in Seyfert galaxies as ∝ Lα, with α< 1. Similarly, Arshakian (2005) found a statistically significant, positive correlation between the half-opening angle of the circumnuclear region of quasars and [O iii] emission-line luminosity. Hence, both the inner radius of the torus and its maximum height are luminosity dependent.
From the conversion of the 2−10 keV X-ray fluxes FX to X-ray luminosities LX (1)where d is the distance of the X-ray source in centimeters (LX is in units of erg/s and FX in erg/s/cm2), it is possible to relate the change in FX with UV luminosity LUV using the relation found by Marchese et al. (2012) when reconstructing the X-ray to optical SED of a sample of 195 X-ray selected type-1 AGN:
  (2)Once the UV luminosity (in erg/s) is estimated, it is easy to infer the inner boundary of the torus. If the torus inner wall coincides with the dust sublimation radius, the estimation of Rin is given by Barvainis (1987) and Kishimoto et al. (2007),
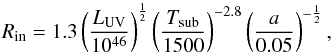 (3)
where Tsub is the dust sublimation temperature for graphite and silicate grains and a is the grain radial size. Kishimoto et al. (2007) fixed Tsub to 1500 K, a value that accounts for the temperature range of ambient gas pressures for both graphite and silicate grains. The grain size was approximated by Barvainis (1987) and fixed to 0.05 μm in order to reflect the size distribution for interstellar graphite grains.
(3)
where Tsub is the dust sublimation temperature for graphite and silicate grains and a is the grain radial size. Kishimoto et al. (2007) fixed Tsub to 1500 K, a value that accounts for the temperature range of ambient gas pressures for both graphite and silicate grains. The grain size was approximated by Barvainis (1987) and fixed to 0.05 μm in order to reflect the size distribution for interstellar graphite grains.
The torus height can be derived thanks to the empirical laws found by Simpson (2005) and Arshakian (2005), who found a relation between the ionizing continuum luminosity and the torus maximum elevation, related to the type-1 AGN fraction f: ![Mathematical equation: \begin{equation} f = 1 - \left[1 + 3 \left(\frac{L_{\rm UV}}{L_0}\right)^{1 - 2\epsilon}\right]^{-\frac{1}{2}} \label{Lum_UV_H}. \end{equation}](/articles/aa/full_html/2016/07/aa28458-16/aa28458-16-eq36.png) (4)Here L0 is the ionizing luminosity at which the number of type-1 and type-2 objects is the same (so that the torus half-opening angle is 60°) and ϵ is an unknown exponent. Both values were numerically fitted to observational data by Simpson (2005), leading to a best-fit parametrization of L0 = 1034.39 W (~8 × 1041 erg/s) and ϵ = 0.23.
(4)Here L0 is the ionizing luminosity at which the number of type-1 and type-2 objects is the same (so that the torus half-opening angle is 60°) and ϵ is an unknown exponent. Both values were numerically fitted to observational data by Simpson (2005), leading to a best-fit parametrization of L0 = 1034.39 W (~8 × 1041 erg/s) and ϵ = 0.23.
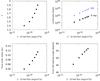 |
Fig. 2 Variation in the key parameters of the torus (Rin and half-opening angle), as well as Γ and the X-ray and UV luminosities of the central engine, with respect to the initial X-ray flux. |
Values for Γ, LX, LUV, Rin, and the torus half-opening angle as a function of the initial X-ray flux are shown in Fig. 2. The variation of Γ with respect to FX is taken from the Rossi X-Ray Timing Explorer monitoring of seven Seyfert 1 galaxies achieved by Markowitz et al. (2003), with a special focus on NGC 4151. Many authors have shown (e.g., Nandra 2001; Chiang 2002; Singal et al. 2012) that the variation of Γ with respect to FX occurs on very short timescales (<2 ks, Ponti et al. 2006) and that the photon index is usually softer for higher X-ray fluxes. In comparison to the kilo-second lags between Γ and FX, the timescale needed for the torus to change its morphology is much longer (≥a year, see Sect. 5.1). Therefore, hereafter we consider that Γ and FX vary instantaneously: fixing Γ in our model is equal to fixing FX, following the relation shown in Fig. 2 (top left).
We note that the LUV values derived from Eq. (2) are consistent with the usual UV luminosities of NGC 4151 (~1043−44 erg/s; see Penston et al. 1990; Robinson et al. 1994; Cassidy & Raine 1996; Minezaki et al. 2004) and give rise to tori with inner radius 0.04 pc <Rin< 0.12 pc (Eq. (3)). The half-opening angle of the circumnuclear structure (Eq. 4) varies between 45° and 57°, in agreement with the receding torus scheme and the observational results of Arshakian (2005).
3. Polarimetric results
The models investigated in this paper share a common root: NGC 4151. We selected this object for its high average X-ray and UV luminosities, which granting easier detection than other less luminous AGN at the same redshift, but also because of the pre-existing collection of optical and infrared polarimetric observations that allowed us to check the validity of our model. We note that the forthcoming results of our investigation are applicable to all Seyfert galaxies regardless of their inclination. Extending our results to slightly lower or higher luminosities is straightforward.
3.1. UV, optical, and NIR polarimetry
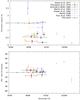 |
Fig. 3 UV, optical, and NIR polarimetric measurements and results of our baseline model based on NGC 4151. Top: polarization degree P; bottom: difference between the radio position angle PA and the polarization position angle PPA (we use the convention PPA = 0 for perpendicular polarization angle and PPA = 90 for parallel polarization). Computational results from STOKES are shown by empty black circles. |
The STOKES code was simultaneously run in the UV, optical, and NIR bands in order to compare the polarimetric results of the code with published spectropolarimetric observations of NGC 4151. We sampled about 1010 initially unpolarized photons, ranging from 2000 to 8000 Å. The continuum photon index Γ was set to 1.6, a value corrected for absorption averaged over 2.5 yr (Markowitz et al. 2003). The resulting torus morphology is thus Rin = 0.076 pc, Rout = 2.0 pc, and half-opening angle = 52.64°. We selected an observer’s line of sight equal to 47° according to the modeling of Das et al. (2005) and Fischer et al. (2013), who determined the inclinations of a sample of nearby AGN using their narrow line region (NLR) kinematics.
Results are shown in Fig. 3, both for the linear continuum polarization degree P and the polarization position angle (PPA). Our model produces a polarization degree on the order of 1.5% in the UV and optical band, with a slight increase at larger wavelengths due to the scattering phase function of the Milky Way dust model used in this simulation (Mathis et al. 1977). The computed PPA is equal to 90° (a polarization angle parallel to the symmetry axis of the model), the typical signature of type-1 AGN.
Comparing our results with archival broadband polarimetric observations, we find that our model successfully reproduces both the polarization degree and position angle of literature data. In particular, the polarization degree resulting from the code is in agreement with the measures of Kemp et al. (1977) despite the large variation in P found by the author around 4200 Å. At this wavelength, the telescope aperture was 15 arcsec, while at larger wavelengths the aperture decreased to 5.9 arcsec. The contribution of the extended (~400 pc) NLR, where perpendicular scattering occurs, is then less important and the resulting net polarization is lower. Our simulation also agrees with the 7000 Å polarization measurements done by Schmidt & Miller (1980) and the optical observations of Martel (1998). However, the optical polarimetry achieved by Thompson et al. (1979), Martin et al. (1983), and Draper et al. (1992) appears to have smaller P. Similarly to Kemp et al. (1977), the authors focused on the core polarization (using apertures smaller than 5 arcsec), neglecting a large fraction of the NLR-scattered polarization. The mid-IR polarimetric observations achieved by Ruiz et al. (2003) indicates that P should decrease with increasing wavelength as a result of the dominance of unpolarized dust reemission over Thomson scattering. Overall, all the polarimetric observations find a polarization position angle coherent with equatorial scattering dominance: the difference between the position angle of the radio axis (77°, as measured by Mundell et al. 2003 and references therein) and the PPA is ~0°.
3.2. X-ray polarimetry
We computed the integrated 2−8 keV polarization from our model for 20 viewing angles θ equally distributed in cos(θ). Dilution from fluorescence emission was taken into account for all the principal elements in the table of abundances of Anders & Ebihara (1982), with most of the unpolarized line photons emitted by the 6.4 keV iron line. The specific energy range of this analysis was selected in order to allow for future comparison with the forthcoming generation of X-ray polarimeters (see Sect. 5.2).
Our analysis is divided into two steps. First, we investigate an X-ray model where the torus is insensitive to the radiation field, i.e., its inner radius and half-opening angle remain constant with variable Γ/FX, so we can check what the expected X-ray polarization is when the torus has no time to react to the variation in the radiation field. Second, we allow the torus to vary with Γ/FX, considering that the timescale of dust destruction/formation by heating/cooling mechanisms is on the same order as the X-ray variability. The real timescale for the torus morphology to react to the change in the central source intensity is probably between the two assumptions and will be discussed in Sect. 5.1.
3.2.1. The static torus case
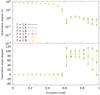 |
Fig. 4 Integrated 2−8 keV polarization degree (top) and polarization position angle (bottom) of our baseline model as a function of the observer’s viewing angle. In this particular case, the torus morphology is considered to have no time to react to the variation in the intensity of the radiation field. |
We fix the internal torus radius to 0.076 pc and its half-opening angle to 52.64° with respect to the polar axis. This parametrization is thus the same as the NIR/optical/UV model investigated above. We allow Γ to vary from 1.4 to 1.9 and look at the integrated 2−8 keV polarization. Results are show in Fig. 4. A direct result is that P is almost insensitive to the variation in Γ (or FX), the difference being lost in the polarization statistics. The dominance of photo-absorption and line emission over scattering in the soft X-ray band explains that the polarization fraction is not very sensitive to the hardness of the initial spectrum.
The integrated polarization degree resulting from multiple scattering is found to be below 2% at type-1 inclinations with a variation that traces the nuclear inclination. At viewing angles closes to the torus horizon, parallel polarization emerging from the accretion disk and the equatorial structure compete with perpendicular scattering from the polar regions and the resulting P decreases. When polar scattering finally dominates, the polarization fraction increases to 70%. The dichotomy between type-1 and type-2 Seyfert galaxies is clearly visible in the PPA plot, where the transition is highlighted by a 90° rotation of the polarization angle. This phenomenon is analogous to what is observed in the optical band (Antonucci 1993).
3.2.2. Receding torus case
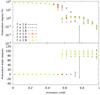 |
Fig. 5 Integrated 2−8 keV polarization degree (top) and polarization position angle (bottom) of our baseline model as a function of the observer’s viewing angle. The torus morphology is now dependent on the variation in radiation intensity. |
We now allow the torus to vary instantaneously with the change in the spectral slope according to the results presented in Fig. 2. The STOKES code, which treats static models, is not able to handle slow physical variations of its morphological parametrization with respect to the radiation field. We thus ran a series of “snapshots” because each model is parametrized with a different photon index. Despite the variation in torus Rin and half-opening angle, we note that the half-opening angle of the NLR region remains set to a value measured by Das et al. (2005); we thus ensure that our model focuses solely on the polarimetric variations due to the receding torus scheme. Slightly higher NLR half-opening angles are not expected to strongly affect the final polarization (Marin et al. 2012, 2015a).
The results of our modeling are compiled in Fig. 5. The situation is quite different from the static torus case where the integrated 2−8 keV polarization is strongly dependent on the torus half-opening angle, which indirectly translate into Γ/FX. For harder initial spectra (small Γ, bulky tori), the transition between type-1 and type-2 classifications occurs at smaller inclinations and the resulting polarization degree is quite low (<1%) over a wide θ range (0−45°). With softer Γ, the transition occurs at larger inclinations owing to the variation in the torus height. It results in a blend of the polarimetric signal between 40° and 60° where the same object could be detected as a type-1 or a type-2 AGN depending on its initial Γ/FX. This is the typical signature of “changing-look” AGN, which are bright type-1 AGN known to show extreme variations (from Compton-thin to Compton-thick regimes; see, e.g., Risaliti et al. 2005; Puccetti et al. 2007; Marchese et al. 2012) in their hydrogen column density situated along the observer’s line of sight1. At larger inclinations, there is no impact of Γ/FX to be detected in the X-ray polarization signal.
According to our simulations, the expected X-ray polarization degree of type-1 Seyfert galaxies should be lower than a few percent, while at type-2 inclinations, P might rise to several tens of percent if there is no source of dilution nearby. This is of course an ideal case as scattered light will probably not be the dominant component of the observed flux. Unpolarized light, which dilutes the net polarization degree, might arise from circumnuclear starburst activity and from a multitude of faint sources such as accreting white dwarfs and coronally active stars (Revnivtsev et al. 2009; Marin et al. 2015b). Nevertheless, the levels of polarization predicted by this model are in agreement with the predictions for NGC 1068 achieved by Goosmann & Matt (2011). These predictions are not affected by the receding torus model, which only affects intermediate AGN types.
4. Application to NGC 4151
NGC 4151 is a spiral galaxy2 harboring a type-1 AGN situated at a distance of 14.066 ± 8.694 Mpc (mean distance and standard deviation for nine redshift-independent distances obtained with AGN time-lag and Tully-Fisher methods, according to the NASA/IPAC extragalactic database). As previously stated, NGC 4151 stands out thanks to its high X-ray fluxes and proximity, turning it into an ideal target for ground-based and space-borne polarimetric observations. NGC 4151 is also know to be a changing-look AGN, where the observed column density of neutral gas varied from ~2 × 10²³ at/cm-2 in 1996 July to ~9 × 10²² at/cm-2 in 2001 December (Puccetti et al. 2007). The changing-look nature of NGC 4151 is in agreement with the nuclear inclination (45°± 5°) derived by Das et al. (2005) and Fischer et al. (2013) and, as seen in Fig. 5, the column density variation could be easily explained by a change in the structure of the obscuring region.
We now study in greater detail the expected polarimetric signature of NGC 4151 in the framework of the static and receding torus schemes. To this end, we took the observed 2−10 keV light curves for NGC 4151 continuum flux and photon index from the Rossi X-Ray Timing Explorer monitoring of Markowitz et al. (2003). The flux and Γ variability will be used as initial inputs for our model. As in Sect. 3, we alternatively investigate the static and receding torus models for a fixed observer’s viewing angle.
4.1. Static torus case
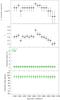 |
Fig. 6 Long timescale light curves for continuum 2−10 keV flux, Γ, polarization degree, and polarization position angle (optical polarization in green, X-ray polarization in black) for a static NGC 4151 model. The continuum flux and photon index light curves are taken from real observations by Markowitz et al. (2003). Consecutive observations are separated by ~30 days. |
The first scenario, which implies a torus morphology that does not have time to react to the change in the initial spectral slope, is presented in Fig. 6. The observer’s line of sight is not obscured by the torus horizon and the central engine is directly visible, so despite an important variation in Γ (from 1.4 to 1.9), the computed polarization signal shows very little change. We show both the optical and X-ray polarization resulting from the model, and find that the expected polarization degree of NGC 4151 is 1.21% ± 0.34% in the X-ray band with a constant parallel polarization position angle. The optical continuum polarization degree and polarization angle are very similar to the X-ray values as the dominant mechanism for scattering-induced polarization is electron scattering. The absorbing medium, either dust grains or atoms, efficiently block radiation along the equatorial plane in the 2−10 keV and optical bands. Differences can arise at smaller wavelengths where hard X-rays can penetrate deeper into the cold gas and escape from the circumnuclear medium Smith & Done (1996), but at these two wavebands X-ray and optical polarization levels are similar. The variability in fractional polarization for transitions between Γ = 1.9 and Γ = 1.4 is not detectable and lost in the error bars.
The stability of the polarization degree and the polarization position angle despite the variation in intrinsic X-ray flux indicates that a future X-ray polarimetric observation would not be affected by variation of the mass accretion rate at the observed level. This would ensure the polarimetric observation to be reliable on long timescales, without the potential effect of polarization angle rotations (such as discussed in the next section). Even though we assumed the timescales for dust formation and destruction are longer than the flux variation, we now relax this assumption.
4.2. Receding torus case
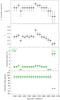 |
Fig. 7 Long timescale light curves for continuum 2−10 keV flux, Γ, polarization degree, and polarization position angle (optical polarization in green, X-ray polarization in black) of NGC 4151 in the case of a Γ-sensitive torus. The continuum flux and photon index light curves are taken from real observations by Markowitz et al. (2003). Consecutive observations are separated by ~30 days. |
The second NGC 4151 scenario allows the torus morphology to vary instantaneously and the parametrization of the model follows the calculations presented in Sect. 2. The output of STOKES is shown in Fig. 7. In the case of the receding torus scheme, both the degree and angle of polarization (either in the optical and soft X-ray band) are sensitive to the variation in flux. However, as illustrated in Fig. 8, the P- and PPA-dependences are not linearly correlated with the half-opening angle of the torus (linked with Γ, see Fig. 2). The net polarization strongly depends on the radiative coupling between the different AGN constituents where the contribution from the polar outflows strongly contributes to the global polarization properties of NGC 4151. For hard Γ indexes (≤1.4), the inner radius of the torus is closer to the central black hole (Rin = 0.04 pc) and the obscuring equatorial torus is puffed up by the lack of intense radiation coming from the central engine (half-opening angle of 45.6°). The observer’s line of sight becomes obstructed by gas and dust clouds that prevent a direct view of the torus funnel. Radiation mainly escapes by polar scattering onto the ionized winds, giving rise to strong (~4%−6%) perpendicular polarization. However, at Γ = 1.5 the torus horizon (half-opening angle of 50.2°) no longer intercepts the line of sight of the distant observer and the equatorial scattering contribution starts to dominate. The polarization angle switches from perpendicular to parallel and P decreases below 0.4% owing to the canceling contributions of photons from the polar and equatorial scattering structures. Finally, at softer Γ (≥1.6), equatorial scattering dominates and P becomes more stable (1.5% ± 0.3%).
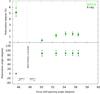 |
Fig. 8 Computed optical (green) and X-ray (black) polarization as a function of the torus half-opening angle (defined with respect to the symmetry axis of the model) in the framework of the receding torus scheme. The line of sight (dashed line) and AGN geometry correspond to those of NGC 4151. |
In the framework of the receding torus model, NGC 4151 would be subject to drastic changes in polarization at low Γ: P varies between 0.1% to 6% and the polarization position angle can rotate by 90° between two epochs and in two different energy bands. If the timescales for the radiation source and torus morphology variations are relatively similar, strong optical and X-ray polarimetric signatures are thus predicted in connection with the dynamical evolution of the dusty medium in the inner parsec of an AGN.
5. Discussion
5.1. Timescale of polarization variability
What are the timescales for the torus to react to the change in the intensity of the central engine? The light travel time for a photon emitted close to the central supermassive black hole to reach the inner 0.1 pc radius of the torus is about 107 s (~4 months). The dust grains will then react to the stronger/weaker radiation field by sublimation/condensation processes and a yet-to-be-determined amount of time will be necessary for the torus to balance its temperature again. Constraining the properties of the subparsec dusty environment using variability is not straightforward, but several attempts have been made, specifically on NGC 4151. Koshida et al. (2009) tried to estimate the timescale for variation in the inner radius of the NGC 4151 torus by cross-correlating its longterm (2001−2006) optical and NIR emission. The different time lags between the emission from the disk (optical) and the torus (IR) were not consistent with a fixed inner radius. In particular, the time lags of Koshida et al. (2009) deviate from the  relation inferred from dust reverberation studies (Barvainis 1987, 1992), pointing towards a morphological variation of one of the two emitters. The timescale for dust replenishment in the central region of NGC 4151 was then estimated to be about one year in order to match the elapsed time between the variable time lags. A second and independent estimation of the timescale for dust formation and destruction in NGC 4151 was achieved by Kishimoto et al. (2013) using NIR interferometry. The authors found that the apparent variation of visibility in the observations taken between 2008 and 2011 points toward a slightly longer delay of a few years to explain the torus inner radius evolution. To narrow down the uncertainties on timescales, Hönig & Kishimoto (2011) used a new simulation code to model time-variable IR emission from dusty tori and examined the light curves of NGC 4151 extracted from Koshida et al. (2009). They successfully reproduced the observed variability signal using a simplified clumpy environment, and they also found that almost half of the energy in the optical variability is converted into IR variability. However, the code used by the authors does not yet include a change in sublimation radius with the source intensity. Forthcoming realizations of the code with upgraded physics will be able to precisely confirm or infer the one-year timescale estimation made by Koshida et al. (2009).
If we consider that a year is necessary for the torus to be in temperature equilibrium after dust sublimation or condensation resulting from a year-long, stable, bright or quiescent activity, the polarimetric variability should lag behind the flux fluctuation by the same amount of time. Therefore, it is useful to conduct long-term optical and X-ray polarimetric observations, regularly spaced in one-year periods of time, in order to catch the change in torus morphology with time in the receding torus framework. Additionally, for AGN with the same inclination but different time-averaged Γ, single pointing observations will be able to reveal differences in optical and X-ray polarization between soft (~2.0) and hard (≤1.4) photon indexes.
Another important aspect is that short-term variations in the intensity of the central engine (on timescales of less than 100 ks; see Markowitz et al. 2003) will not affect the polarization measurements. The torus will not have time to react to the flickering of the corona emission (which lasts less than a day), meaning that a megasecond-long polarimetric observation sure to be robust whatever the sudden onset or offset of intensity.
5.2. Detectability with modern polarimeters
Modern X-ray polarimeters are based on the photoelectric effect, a promising and highly sensitive basis for new polarimeters. There are two concepts, one based on the time-projection chamber technique (Black et al. 2007) and one on the gas-pixel technology (Costa et al. 2001; Bellazzini & Muleri 2010); the latter has the advantage of recovering the two-dimensional position of the incoming photon, allowing for polarization mapping. The gas-pixel technology is used in two X-ray polarimetry missions proposed to NASA and ESA for a potential launch within the next decade. The IXPE (Imaging X-ray Polarimetry Explorer – NASA/SMEX proposal) and XIPE (X-ray Imaging Polarimetry Explorer – ESA M4 candidate) missions should carry a set of 2−8 keV polarimeters that are sensitive enough to record the polarization of nearby AGN such as NGC 4151 or NGC 1068.
However, X-ray polarization measurements are photon hungry, as the I, Q, and U parameters of the Stokes vector (used to quantify linear polarization) must be recorded with sufficient statistics. In the case of an X-ray polarimeter with an ideal response to polarization, 4 × 10⁶ photons will be needed to detect a 1% polarization signal against the statistical fluctuations, if we accept a 10σ standard deviation. Bright AGN only radiate at a rate of a few tens of counts per second per square meter in the X-ray band, so X-ray polarimetry is time consuming. Unfortunately, most of AGN situated in the local Universe are fainter than 10 cts/s/m2 (and the brightest z> 1 quasars only radiate at a rate of 1 ct/s/m2), so exposition times will increase.
It is then necessary to estimate the amount of time necessary to detect a minimum polarization threshold that corresponds to our predicted polarization degrees.In the photon energy range from 2 to 10 keV, NGC 4151 has a time-averaged flux of 11.3 × 10⁻¹¹ erg/s/cm2 (equivalent to 5.65 mCrab, Wang et al. 2010). To detect a polarization signal at the 3σ confidence level when the background flux is negligible with respect to the source flux, using a total collecting area >1100 cm2 at 3 keV, 940 ks are required in the case of a threshold polarization value of 1.21% (Sect. 4.1), 610 ks when P is 1.50% (Sect. 4.2, soft Γ), and 52 ks when P is 5.13% (Sect. 4.2, hard Γ). The estimated values of the uncertainties at 1σ on the polarization angle are lower than 10°. Values are estimated using the software developed by the XIPE instrumentation team, based on the formulas presented in Soffitta et al. (2013).
6. Conclusions and future work
We have undertaken broadband simulations of the polarization degree and position angle emerging from scattering in a complex AGN environment powered by a flickering continuum source. Our results, spanning from the near-infrared to the X-ray band, allowed us to test our model against optical and IR spectropolarimetric observations and to predict the amount of polarization a future X-ray polarimeter would detect in NGC 4151. We tested the impact of a receding torus, whose inner radius and half-opening angle are dependent on the intensity of the radiation field, on the optical and X-ray polarimetric signatures of a prototypical AGN. We critically discussed our results in terms of timescales and feasibility with a photoelectric polarimeter. We summarize our findings below:
-
1.
We tested the relevance of our baseline model by reproducingthe degree and position angle of past NGC 4151polarimetric observations in the optical and NIR bands. By sodoing, we also predicted the degree of polarization to be detectedin the UV band (~1.5%).
-
2.
The integrated 2−8 keV polarization in a standard AGN model varies from a few percent at type-1 inclinations to tens of percent at type-2 viewing angles. Only the viewing angle close to the type-1/type-2 transition is affected by the receding torus model.
-
3.
Applied to NGC 4151, our model predicts that the polarization degree is almost the same in the optical and X-ray bands, with an estimated value on the order of 1.21% ± 0.34%. We expect a constant parallel polarization position angle if the timescale necessary for the dust to evaporate or condense is longer than the long-term flux variability. On the other hand, if the dusty structure is able to evolve fast enough, its polarization degree will vary from 0.1% to 6% depending on the photon index. An orthogonal rotation of the polarization position angle appears at hard Γ for both wavebands, otherwise the polarization is parallel to the radio axis.
-
4.
The variation of P with long-term flux variability will not be detectable if the torus morphology remains static. The same applies to the receding torus framework for soft Γ. This is a strong argument for the reliability of X-ray polarization measurements since variations in Γ will not cancel P owing to rapid rotations of the PPA.
-
5.
Pointing at changing-look AGN using an X-ray polarimeter, it will be possible to constrain the inner radius of the dusty structure, as well as its half-opening angle and the observer’s inclination thanks to the observed variability (or lack thereof) in polarization. A joint optical and soft X-ray band proposal could greatly strengthen the polarimetric analyses.
-
6.
Using modern photoelectric polarimeters such as the ones on board the medium-sized mission project XIPE, we determined that – in the most conservative case scenario –940 ks observing time will be needed to obtained a 3σ confidence level polarization measurement of NGC 4151. If the receding torus model is real, the observing time decreases to 610 ks for Γ ≥ 1.6, and 52 ks for Γ ≤ 1.4.
-
7.
The ideal monitoring campaign for an X-ray polarimetric mission equipped with a 2−8 keV instrument and looking at NGC 4151 to constrain its torus inner radius and half-opening angle is a long-term program. A preliminary plan is to achieve 600 ks observations spaced apart in time according to the timescale for dust replenishment close to the sublimation radius, i.e., 1 yr.
While our model is based on the unified scheme for AGN, several improvements can be envisioned. First, the impact of fragmentation will be investigated in detail using the code STOKES, where the reprocessed flux and polarization from a clumpy toroidal structure will be modeled. Our results will be directly comparable to the recent simulations by Furui et al. (2016) and He et al. (2016), with the advantage of simultaneously predicting the polarization degree and position angle of smooth and clumpy molecular tori. This work will be conducted in a wide range of wavelengths, from the infrared to the hard X-ray band in order to look in great detail at the receding torus scheme.
We also aim to implement the impact of general relativistic effects close to the central supermassive black hole. The thermally emitted UV photons, which travel from the accretion disk to the corona, will be scattered to higher energy and will then either fall back onto the disk or travel to the observer. The trajectories of the photos will follow the photon-null geodesics, at least in the few tens of gravitational radii around the potential well. According to Connors & Stark (1977) and Connors et al. (1980), the polarization position angle of radiation will change non-linearly according to the physical parameters of the model. Using general relativistic routines (Dovčiak et al. 2011), we will investigate to what degree a polarized primary source will affect the net polarization detected by a future X-ray polarimeter.
The timescales for Compton-thin to Compton-thick variation in nH is object dependent. In the case of NGC 4151, the regime transition happens in timescales of years; see Sect. 4.
Apparently dubbed the “Eye of Sauron” by the astronomy community.
Acknowledgments
The authors are grateful to the referee Makoto Kishimoto for his useful and constructive comments on the manuscript. This research has been partially funded by the French PNHE, F.M. and R.G. were supported by the grant ANR-11-JS56-013-01 “POLIOPTIX” and by the European Union Seventh Framework Programme (FP7/2007-2013) under grant agreement no. 312789 “StrongGravity”. P.O.P. acknowledges financial support from CNES.
References
- Anders, E., & Ebihara, M. 1982, Geochim. Cosmochim. Acta, 46, 2363 [NASA ADS] [CrossRef] [Google Scholar]
- Antonucci, R. 1993, ARA&A, 31, 473 [Google Scholar]
- Antonucci, R. R. J., & Miller, J. S. 1985, ApJ, 297, 621 [NASA ADS] [CrossRef] [Google Scholar]
- Arshakian, T. G. 2005, A&A, 436, 817 [NASA ADS] [CrossRef] [EDP Sciences] [Google Scholar]
- Barvainis, R. 1987, ApJ, 320, 537 [NASA ADS] [CrossRef] [Google Scholar]
- Barvainis, R. 1992, ApJ, 400, 502 [NASA ADS] [CrossRef] [Google Scholar]
- Bellazzini, R., & Muleri, F. 2010, Nucl. Instr. Meth. Phys. Res. A, 623, 766 [Google Scholar]
- Bianchi, S., Panessa, F., Barcons, X., et al. 2012, MNRAS, 426, 3225 [NASA ADS] [CrossRef] [Google Scholar]
- Black, J. K., Baker, R. G., Deines-Jones, P., Hill, J. E., & Jahoda, K. 2007, Nucl. Instr. Meth. Phys. Res. A, 581, 755 [Google Scholar]
- Cassidy, I., & Raine, D. J. 1996, A&A, 310, 49 [NASA ADS] [Google Scholar]
- Chiang, J. 2002, ApJ, 572, 79 [NASA ADS] [CrossRef] [Google Scholar]
- Clavel, J., Wamsteker, W., & Glass, I. S. 1989, ApJ, 337, 236 [NASA ADS] [CrossRef] [Google Scholar]
- Connors, P. A., & Stark, R. F. 1977, Nature, 269, 128 [NASA ADS] [CrossRef] [Google Scholar]
- Connors, P. A., Stark, R. F., & Piran, T. 1980, ApJ, 235, 224 [NASA ADS] [CrossRef] [Google Scholar]
- Costa, E., Soffitta, P., Bellazzini, R., et al. 2001, Nature, 411, 662 [NASA ADS] [CrossRef] [PubMed] [Google Scholar]
- Das, V., Crenshaw, D. M., Hutchings, J. B., et al. 2005, AJ, 130, 945 [NASA ADS] [CrossRef] [Google Scholar]
- Dorodnitsyn, A., Kallman, T., & Proga, D. 2016, ApJ, 819, 115 [NASA ADS] [CrossRef] [Google Scholar]
- Dovčiak, M., Muleri, F., Goosmann, R. W., Karas, V., & Matt, G. 2011, ApJ, 731, 75 [NASA ADS] [CrossRef] [Google Scholar]
- Draine, B. T. 2003, ApJ, 598, 1026 [NASA ADS] [CrossRef] [Google Scholar]
- Draper, P. W., Gledhill, T. M., Scarrott, S. M., & Tadhunter, C. N. 1992, MNRAS, 257, 309 [NASA ADS] [CrossRef] [Google Scholar]
- Elvis, M. 2000, ApJ, 545, 63 [NASA ADS] [CrossRef] [Google Scholar]
- Elvis, M., Wilkes, B. J., McDowell, J. C., et al. 1994, ApJS, 95, 1 [NASA ADS] [CrossRef] [Google Scholar]
- Fiore, F., Elvis, M., Giommi, P., & Padovani, P. 1998, ApJ, 492, 79 [NASA ADS] [CrossRef] [Google Scholar]
- Fischer, T. C., Crenshaw, D. M., Kraemer, S. B., & Schmitt, H. R. 2013, ApJS, 209, 1 [NASA ADS] [CrossRef] [Google Scholar]
- Furui, S., Fukazawa, Y., Odaka, H., et al. 2016, ApJ, 818, 164 [NASA ADS] [CrossRef] [Google Scholar]
- Goosmann, R. W., & Gaskell, C. M. 2007, A&A, 465, 129 [NASA ADS] [CrossRef] [EDP Sciences] [Google Scholar]
- Goosmann, R. W., & Matt, G. 2011, MNRAS, 415, 3119 [NASA ADS] [CrossRef] [Google Scholar]
- Gopal-Krishna, Kulkarni, V. K., & Wiita, P. J. 1996, ApJ, 463, L1 [NASA ADS] [CrossRef] [Google Scholar]
- Grimes, J. A., Rawlings, S., & Willott, C. J. 2004, MNRAS, 349, 503 [NASA ADS] [CrossRef] [Google Scholar]
- Gu, M., & Cao, X. 2009, MNRAS, 399, 349 [NASA ADS] [CrossRef] [Google Scholar]
- He, J.-J., Liu, Y., & Zhang, S.-N. 2016, MNRAS, 455, 3968 [NASA ADS] [CrossRef] [Google Scholar]
- Hill, G. J., Goodrich, R. W., & Depoy, D. L. 1996, ApJ, 462, 163 [NASA ADS] [CrossRef] [Google Scholar]
- Hoffman, J., & Draine, B. T. 2016, ApJ, 817, 139 [NASA ADS] [CrossRef] [Google Scholar]
- Hönig, S. F., & Kishimoto, M. 2011, A&A, 534, A121 [NASA ADS] [CrossRef] [EDP Sciences] [Google Scholar]
- Jackson, N., & Browne, I. W. A. 1990, Nature, 343, 43 [NASA ADS] [CrossRef] [Google Scholar]
- Kapahi, V. K., & Kulkarni, V. K. 1990, AJ, 99, 1397 [NASA ADS] [CrossRef] [Google Scholar]
- Kemp, J. C., Rieke, G. H., Lebofsky, M. J., & Coyne, G. V. 1977, ApJ, 215, L107 [NASA ADS] [CrossRef] [Google Scholar]
- Kishimoto, M., Hönig, S. F., Beckert, T., & Weigelt, G. 2007, A&A, 476, 713 [NASA ADS] [CrossRef] [EDP Sciences] [Google Scholar]
- Kishimoto, M., Hönig, S. F., Tristram, K. R. W., & Weigelt, G. 2009, A&A, 493, L57 [NASA ADS] [CrossRef] [EDP Sciences] [Google Scholar]
- Kishimoto, M., Hönig, S. F., Antonucci, R., et al. 2013, ApJ, 775, L36 [NASA ADS] [CrossRef] [Google Scholar]
- Koshida, S., Yoshii, Y., Kobayashi, Y., et al. 2009, ApJ, 700, L109 [NASA ADS] [CrossRef] [Google Scholar]
- Lawrence, A. 1991, MNRAS, 252, 586 [NASA ADS] [Google Scholar]
- Marchese, E., Della Ceca, R., Caccianiga, A., et al. 2012, A&A, 539, A48 [NASA ADS] [CrossRef] [EDP Sciences] [Google Scholar]
- Marin, F., & Goosmann, R. W. 2014, in SF2A-2014: Proc. Annual meeting of the French Society of Astronomy and Astrophysics, eds. J. Ballet, F. Martins, F. Bournaud, R. Monier, & C. Reylé, 103 [Google Scholar]
- Marin, F., Goosmann, R. W., Gaskell, C. M., Porquet, D., & Dovčiak, M. 2012, A&A, 548, A121 [NASA ADS] [CrossRef] [EDP Sciences] [Google Scholar]
- Marin, F., Goosmann, R. W., & Gaskell, C. M. 2015a, A&A, 577, A66 [Google Scholar]
- Marin, F., Muleri, F., Soffitta, P., Karas, V., & Kunneriath, D. 2015b, A&A, 576, A19 [NASA ADS] [CrossRef] [EDP Sciences] [Google Scholar]
- Markowitz, A., Edelson, R., & Vaughan, S. 2003, ApJ, 598, 935 [NASA ADS] [CrossRef] [Google Scholar]
- Martel, A. R. 1998, ApJ, 508, 657 [NASA ADS] [CrossRef] [Google Scholar]
- Martin, P. G., Thompson, I. B., Maza, J., & Angel, J. R. P. 1983, ApJ, 266, 470 [NASA ADS] [CrossRef] [Google Scholar]
- Mathis, J. S., Rumpl, W., & Nordsieck, K. H. 1977, ApJ, 217, 425 [NASA ADS] [CrossRef] [Google Scholar]
- Minezaki, T., Yoshii, Y., Kobayashi, Y., et al. 2004, ApJ, 600, L35 [NASA ADS] [CrossRef] [Google Scholar]
- Mundell, C. G., Wrobel, J. M., Pedlar, A., & Gallimore, J. F. 2003, ApJ, 583, 192 [NASA ADS] [CrossRef] [Google Scholar]
- Nandra, K. 2001, Adv. Space Res., 28, 295 [NASA ADS] [CrossRef] [Google Scholar]
- Oknyanskij, V. L., & Horne, K. 2001, in Probing the Physics of Active Galactic Nuclei, eds. B. M. Peterson, R. W. Pogge, & R. S. Polidan, ASP Conf. Ser., 224, 149 [Google Scholar]
- Panessa, F., Carrera, F. J., Bianchi, S., et al. 2009, MNRAS, 398, 1951 [NASA ADS] [CrossRef] [Google Scholar]
- Penston, M. V., Robinson, A., Alloin, D., et al. 1990, A&A, 236, 53 [NASA ADS] [Google Scholar]
- Ponti, G., Miniutti, G., Cappi, M., et al. 2006, MNRAS, 368, 903 [NASA ADS] [CrossRef] [Google Scholar]
- Proga, D. 2007, ApJ, 661, 693 [NASA ADS] [CrossRef] [Google Scholar]
- Puccetti, S., Fiore, F., Risaliti, G., et al. 2007, MNRAS, 377, 607 [NASA ADS] [CrossRef] [Google Scholar]
- Revnivtsev, M., Sazonov, S., Churazov, E., et al. 2009, Nature, 458, 1142 [NASA ADS] [CrossRef] [PubMed] [Google Scholar]
- Risaliti, G., Elvis, M., Fabbiano, G., Baldi, A., & Zezas, A. 2005, ApJ, 623, L93 [NASA ADS] [CrossRef] [Google Scholar]
- Robinson, A., Vila-Vilaro, B., Axon, D. J., et al. 1994, A&A, 291, 351 [NASA ADS] [Google Scholar]
- Ruiz, M., Young, S., Packham, C., Alexander, D. M., & Hough, J. H. 2003, MNRAS, 340, 733 [NASA ADS] [CrossRef] [Google Scholar]
- Sanders, D. B., Phinney, E. S., Neugebauer, G., Soifer, B. T., & Matthews, K. 1989, ApJ, 347, 29 [NASA ADS] [CrossRef] [Google Scholar]
- Schmidt, G. D., & Miller, J. S. 1980, ApJ, 240, 759 [NASA ADS] [CrossRef] [Google Scholar]
- Schnülle, K., Pott, J.-U., Rix, H.-W., et al. 2015, A&A, 578, A57 [NASA ADS] [CrossRef] [EDP Sciences] [Google Scholar]
- Simpson, C. 2005, MNRAS, 360, 565 [NASA ADS] [CrossRef] [Google Scholar]
- Singal, J., Petrosian, V., & Ajello, M. 2012, ApJ, 753, 45 [NASA ADS] [CrossRef] [Google Scholar]
- Smith, D. A., & Done, C. 1996, MNRAS, 280, 355 [NASA ADS] [CrossRef] [Google Scholar]
- Smith, J. E., Robinson, A., Alexander, D. M., et al. 2004, MNRAS, 350, 140 [Google Scholar]
- Soffitta, P., Barcons, X., Bellazzini, R., et al. 2013, Exp. Astron., 36, 523 [NASA ADS] [CrossRef] [Google Scholar]
- Steffen, A. T., Barger, A. J., Cowie, L. L., Mushotzky, R. F., & Yang, Y. 2003, ApJ, 596, L23 [NASA ADS] [CrossRef] [Google Scholar]
- Thompson, I., Angel, J. R. P., Stockman, H. S., et al. 1979, ApJ, 229, 909 [NASA ADS] [CrossRef] [Google Scholar]
- Turner, T. J., George, I. M., Nandra, K., & Mushotzky, R. F. 1997, ApJS, 113, 23 [NASA ADS] [CrossRef] [Google Scholar]
- Urry, C. M., & Padovani, P. 1995, PASP, 107, 803 [NASA ADS] [CrossRef] [Google Scholar]
- Ursini, F., Boissay, R., Petrucci, P.-O., et al. 2015, A&A, 577, A38 [NASA ADS] [CrossRef] [EDP Sciences] [Google Scholar]
- Wang, J., Risaliti, G., Fabbiano, G., et al. 2010, ApJ, 714, 1497 [NASA ADS] [CrossRef] [Google Scholar]
- Weymann, R. J., Morris, S. L., Foltz, C. B., & Hewett, P. C. 1991, ApJ, 373, 23 [NASA ADS] [CrossRef] [Google Scholar]
- Willott, C. J., Rawlings, S., Blundell, K. M., & Lacy, M. 2000, MNRAS, 316, 449 [NASA ADS] [CrossRef] [Google Scholar]
- Willott, C. J., Rawlings, S., Blundell, K. M., Lacy, M., & Eales, S. A. 2001, MNRAS, 322, 536 [NASA ADS] [CrossRef] [Google Scholar]
- Young, S. 2000, MNRAS, 312, 567 [NASA ADS] [CrossRef] [Google Scholar]
All Tables
All Figures
|
Fig. 1 Emission and scattering geometry in our baseline model. The box is a zoom on the central AGN region. The outer radius of the polar outflows (shown in yellow) are truncated to fit the sketch. Sizes and geometries are detailed in Table 1. |
| In the text | |
|
Fig. 2 Variation in the key parameters of the torus (Rin and half-opening angle), as well as Γ and the X-ray and UV luminosities of the central engine, with respect to the initial X-ray flux. |
| In the text | |
|
Fig. 3 UV, optical, and NIR polarimetric measurements and results of our baseline model based on NGC 4151. Top: polarization degree P; bottom: difference between the radio position angle PA and the polarization position angle PPA (we use the convention PPA = 0 for perpendicular polarization angle and PPA = 90 for parallel polarization). Computational results from STOKES are shown by empty black circles. |
| In the text | |
|
Fig. 4 Integrated 2−8 keV polarization degree (top) and polarization position angle (bottom) of our baseline model as a function of the observer’s viewing angle. In this particular case, the torus morphology is considered to have no time to react to the variation in the intensity of the radiation field. |
| In the text | |
|
Fig. 5 Integrated 2−8 keV polarization degree (top) and polarization position angle (bottom) of our baseline model as a function of the observer’s viewing angle. The torus morphology is now dependent on the variation in radiation intensity. |
| In the text | |
|
Fig. 6 Long timescale light curves for continuum 2−10 keV flux, Γ, polarization degree, and polarization position angle (optical polarization in green, X-ray polarization in black) for a static NGC 4151 model. The continuum flux and photon index light curves are taken from real observations by Markowitz et al. (2003). Consecutive observations are separated by ~30 days. |
| In the text | |
|
Fig. 7 Long timescale light curves for continuum 2−10 keV flux, Γ, polarization degree, and polarization position angle (optical polarization in green, X-ray polarization in black) of NGC 4151 in the case of a Γ-sensitive torus. The continuum flux and photon index light curves are taken from real observations by Markowitz et al. (2003). Consecutive observations are separated by ~30 days. |
| In the text | |
|
Fig. 8 Computed optical (green) and X-ray (black) polarization as a function of the torus half-opening angle (defined with respect to the symmetry axis of the model) in the framework of the receding torus scheme. The line of sight (dashed line) and AGN geometry correspond to those of NGC 4151. |
| In the text | |
Current usage metrics show cumulative count of Article Views (full-text article views including HTML views, PDF and ePub downloads, according to the available data) and Abstracts Views on Vision4Press platform.
Data correspond to usage on the plateform after 2015. The current usage metrics is available 48-96 hours after online publication and is updated daily on week days.
Initial download of the metrics may take a while.