Fig. 3
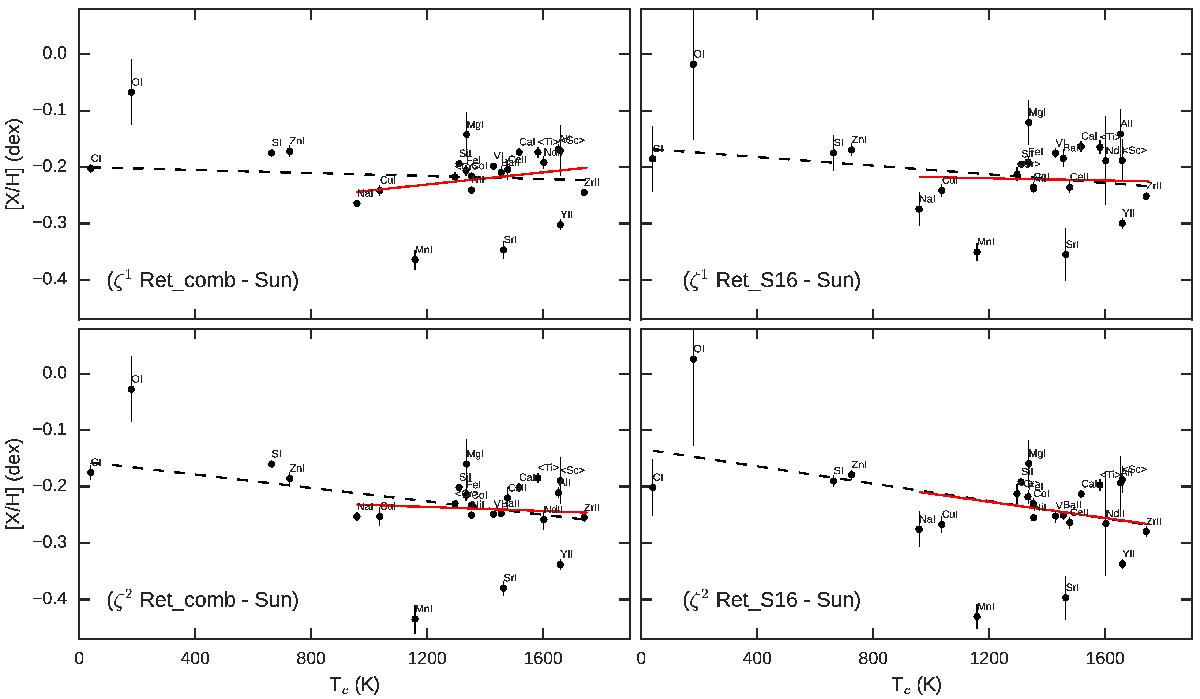
Differential abundances [X/H] against condensation temperature for ζ1 Ret and ζ2 Ret. The abundances are derived relative to the Sun with the combined spectra and spectra from S16. The black dashed line represents the trend when all of the elements are used for the linear regression and the red line is the result of the linear regression when only elements with Tc> 900 K are used.
Current usage metrics show cumulative count of Article Views (full-text article views including HTML views, PDF and ePub downloads, according to the available data) and Abstracts Views on Vision4Press platform.
Data correspond to usage on the plateform after 2015. The current usage metrics is available 48-96 hours after online publication and is updated daily on week days.
Initial download of the metrics may take a while.