Fig. 8
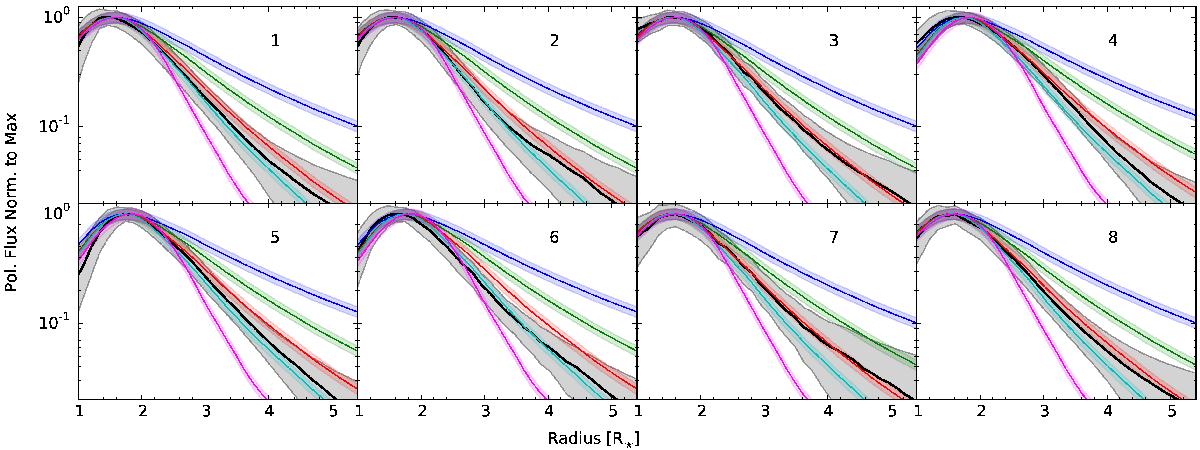
Comparison between the radial profile of the polarised intensity obtained from models and from the observations in V (black line) for the different octants. Octant one is limited by the north and north-east directions and the numeration follows clock-wise. The grey-filled region shows the three-σ errors from combining the uncertainty given by the ESO pipeline with that from choosing the central pixel. The different octants are identified by number in each panel (see Sect. 2.2.2). We show the best fit models for: a thin halo (pink line), n = 5 (cyan line), n = 4 (red line), n = 3 (green line), and n = 2 (blue line). The filled regions around the model lines show variation with direction introduced by the convolution with the PSF.
Current usage metrics show cumulative count of Article Views (full-text article views including HTML views, PDF and ePub downloads, according to the available data) and Abstracts Views on Vision4Press platform.
Data correspond to usage on the plateform after 2015. The current usage metrics is available 48-96 hours after online publication and is updated daily on week days.
Initial download of the metrics may take a while.