Fig. 7
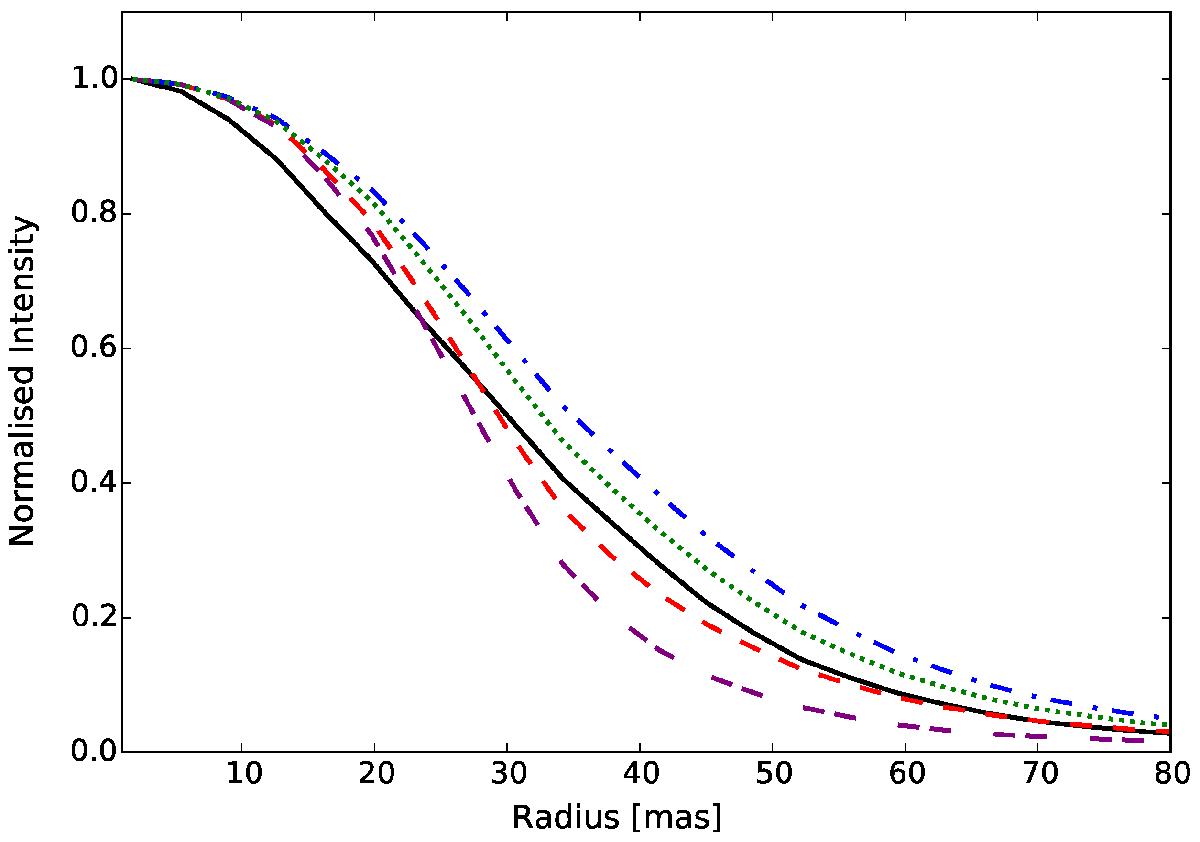
Observed azimuthally-averaged radial profile of the total intensity in the second-epoch cntHα images (full black line) compared to models with τV = 0.65, R° = 1.5 R⋆, and n = 4 (dashed red line), τV = 1.3, R° = 1.45 R⋆, and n = 4.5 (dotted green line), and τV = 1.9, R° = 1.4 R⋆, and n = 5 (dotted-dashed blue line). The values of R° and n for each of the dust models shown have been determined by fitting the radial profile of the polarised intensity. For reference, we also show the radial profile of our model star with no dust envelope (double-dashed purple line).
Current usage metrics show cumulative count of Article Views (full-text article views including HTML views, PDF and ePub downloads, according to the available data) and Abstracts Views on Vision4Press platform.
Data correspond to usage on the plateform after 2015. The current usage metrics is available 48-96 hours after online publication and is updated daily on week days.
Initial download of the metrics may take a while.