Fig. 6
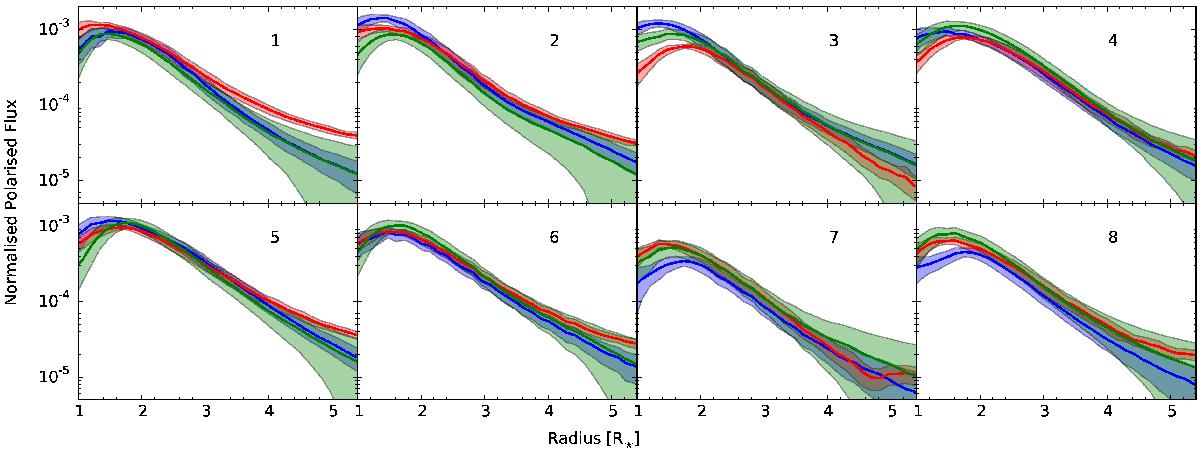
Comparison between the radial profile of the polarised intensity for the different octants obtained from the observations in the first epoch in V (green line) and in cntHα (red line), and in the second epoch in cntHα (blue line). The profiles were normalised using the value of the integrated polarised intensity for each filter. The octants are identified in each panel (see Sect. 2.2.2). The filled region shows the three-σ errors from combining the uncertainty given by the ESO pipeline with that from choosing the central pixels.
Current usage metrics show cumulative count of Article Views (full-text article views including HTML views, PDF and ePub downloads, according to the available data) and Abstracts Views on Vision4Press platform.
Data correspond to usage on the plateform after 2015. The current usage metrics is available 48-96 hours after online publication and is updated daily on week days.
Initial download of the metrics may take a while.