Fig. 4
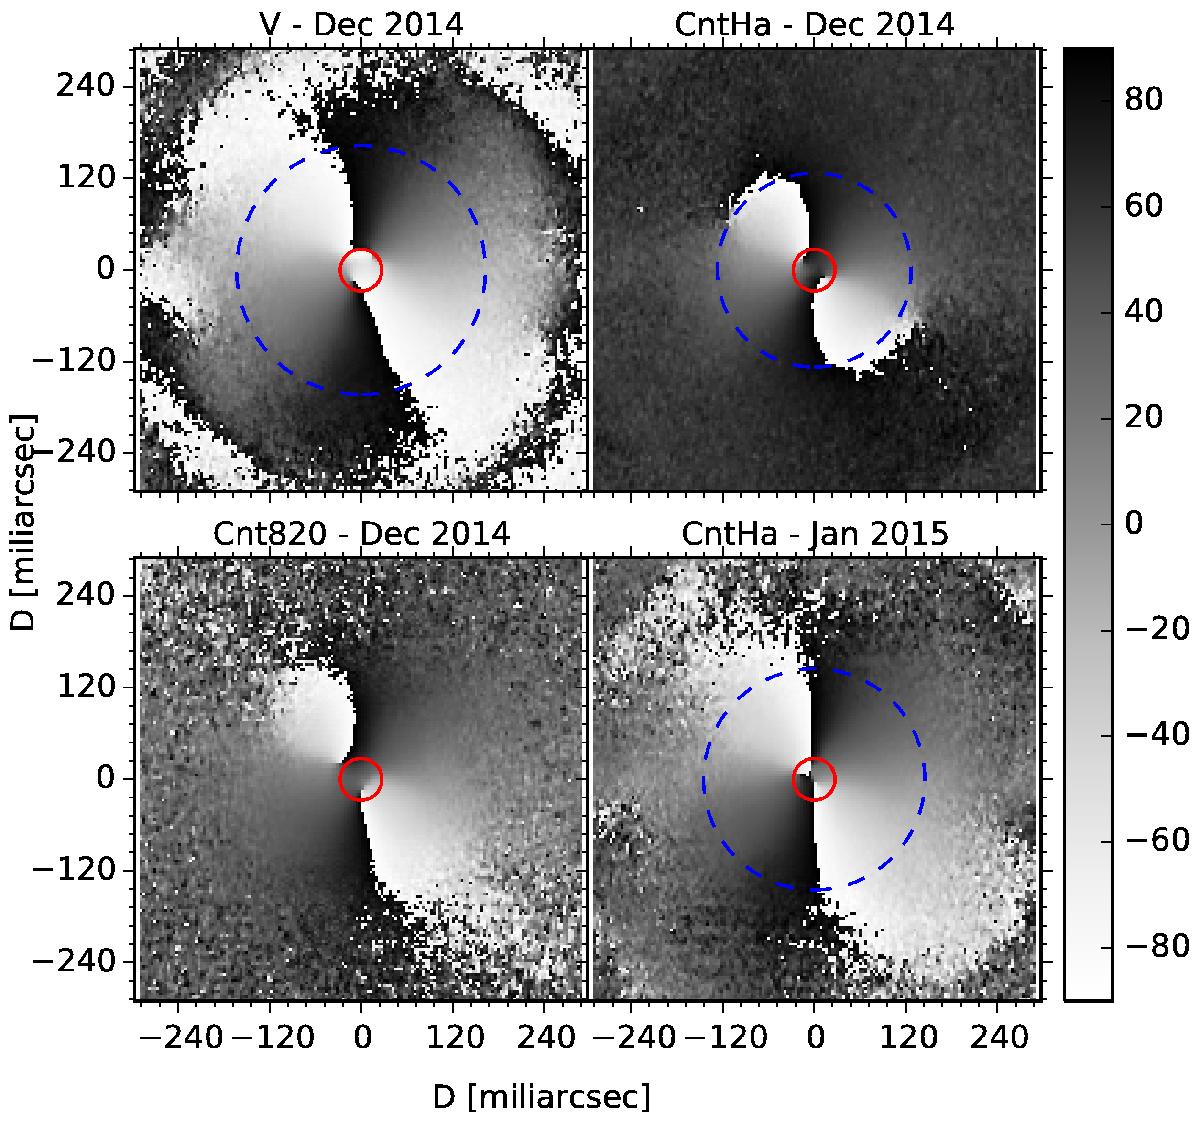
Direction of the measured polarisation vector for the four images given in degrees relatively to the north direction. The red circles show the size of the stellar disc derived by Norris et al. (2012) from observations in the near-infrared (also shown in Figs. 1–3, and 5). The dashed blue circles enclose the regions where we find the polarised intensity produced in the envelope to be a factor of three larger than the expected instrumental polarisation (not shown for cnt820, see Sect. 2.2.2).
Current usage metrics show cumulative count of Article Views (full-text article views including HTML views, PDF and ePub downloads, according to the available data) and Abstracts Views on Vision4Press platform.
Data correspond to usage on the plateform after 2015. The current usage metrics is available 48-96 hours after online publication and is updated daily on week days.
Initial download of the metrics may take a while.