Fig. 3
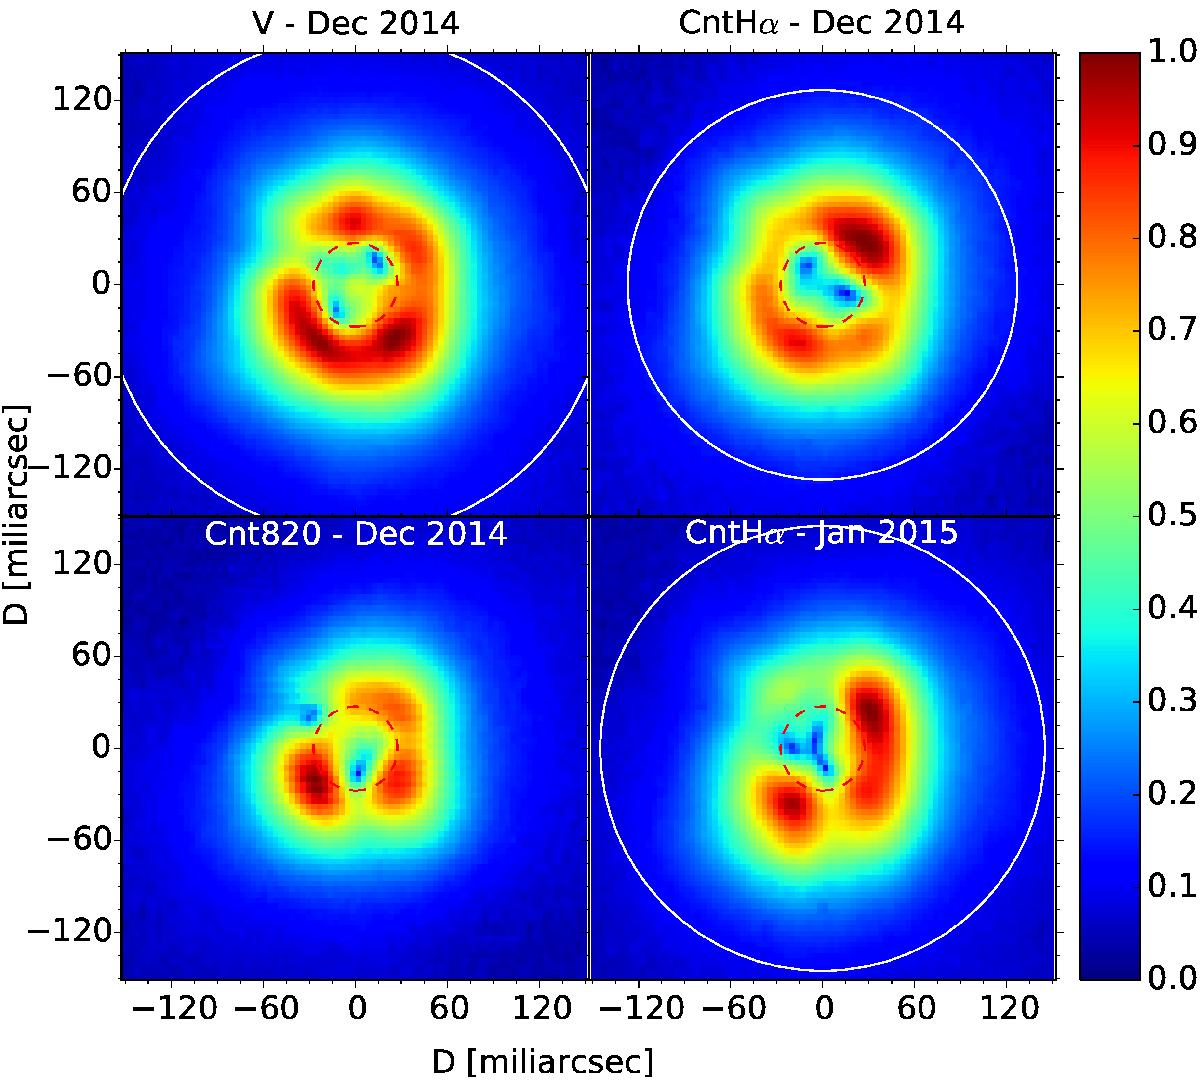
Polarised intensity seen in V, cntHα, and in cnt820 on 11-Dec.-2014 and in cntHα on 28-Jan.-2015 normalised to the peak value, shown with a square-root scaling. The dashed red circles show the size of the stellar disc derived by Norris et al. (2012) from observations in the near-infrared (also shown in Figs. 1–5). The white circles (not shown for cnt820, see Sect. 2.2.2) mark the region where we find the polarised light produced in the envelope to dominate over instrumental effects.
Current usage metrics show cumulative count of Article Views (full-text article views including HTML views, PDF and ePub downloads, according to the available data) and Abstracts Views on Vision4Press platform.
Data correspond to usage on the plateform after 2015. The current usage metrics is available 48-96 hours after online publication and is updated daily on week days.
Initial download of the metrics may take a while.