Fig. 1
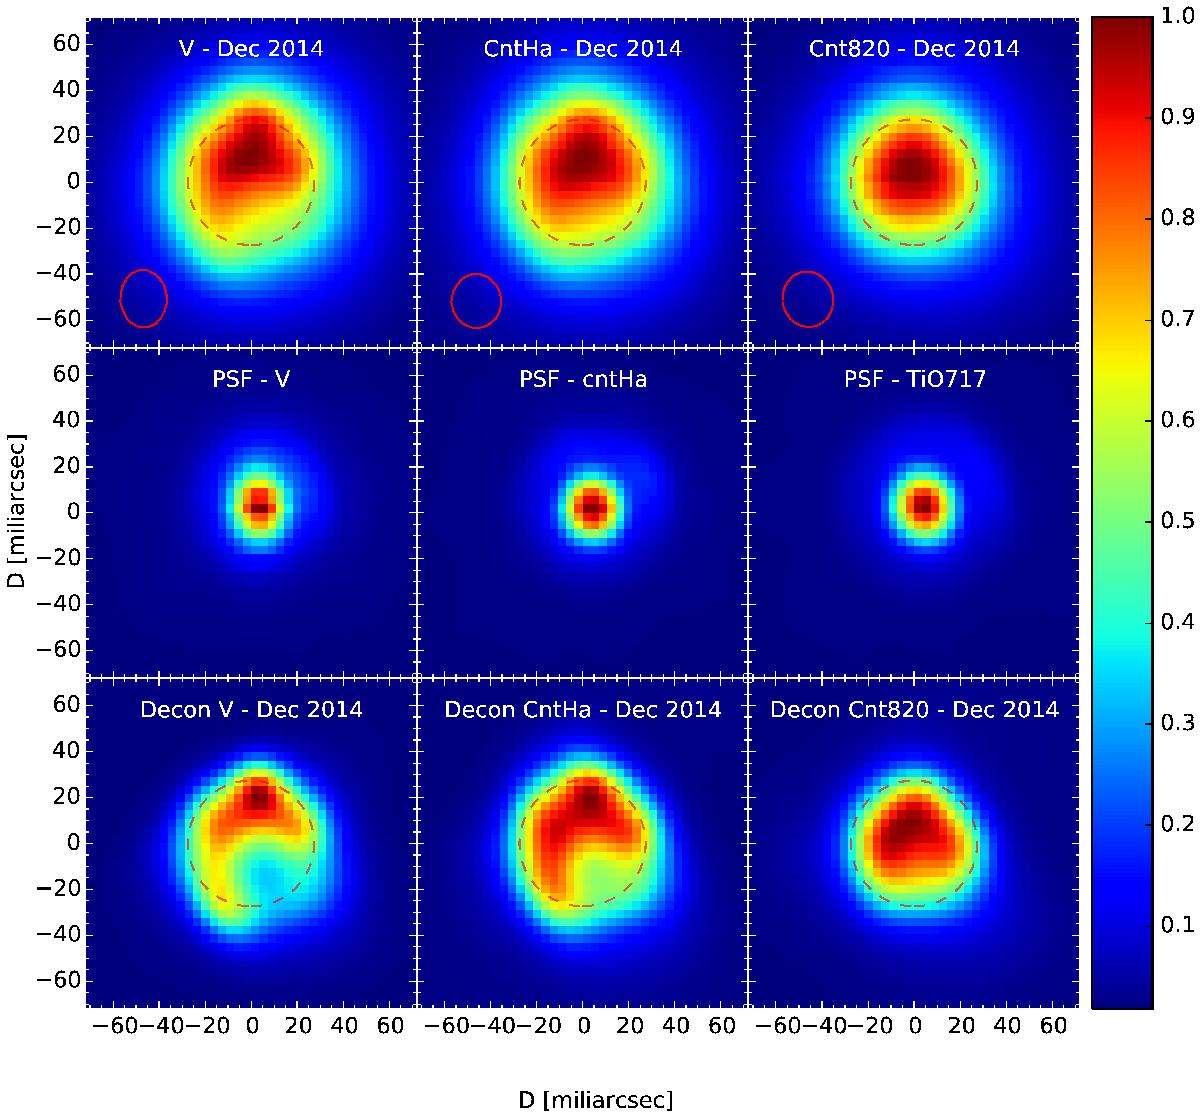
Top panels: total intensity normalised using the peak flux as observed using ZIMPOL on 10- and 11-Dec.-2014 in the three filters, V, cntHα, and cnt820. Middle panels: images of the PSF-reference star ψ2 Ori normalised to the peak flux. Bottom panels: corresponding deconvolved images, again normalised using the peak flux. The dashed red circles show the size of the stellar disc derived by Norris et al. (2012) from observations in the near-infrared (same as shown in Figs. 2–5). The full red circles show the FWHM of the PSF used as reference.
Current usage metrics show cumulative count of Article Views (full-text article views including HTML views, PDF and ePub downloads, according to the available data) and Abstracts Views on Vision4Press platform.
Data correspond to usage on the plateform after 2015. The current usage metrics is available 48-96 hours after online publication and is updated daily on week days.
Initial download of the metrics may take a while.