| Issue |
A&A
Volume 591, July 2016
|
|
|---|---|---|
| Article Number | L2 | |
| Number of page(s) | 4 | |
| Section | Letters | |
| DOI | https://doi.org/10.1051/0004-6361/201628427 | |
| Published online | 06 June 2016 | |
Abundance of HOCO+ and CO2 in the outer layers of the L1544 prestellar core
1 Université de Toulouse, UPS-OMP, IRAP, 31013 Toulouse, France
e-mail: This email address is being protected from spambots. You need JavaScript enabled to view it.
2 CNRS, IRAP, 9 Av. Colonel Roche, BP 44346, 31028 Toulouse Cedex 4, France
3 Université de Grenoble Alpes, IPAG, 38000 Grenoble, France
4 CNRS, IPAG, 38000 Grenoble, France
5 Observatorio Astronómico Nacional (OAN, IGN), Calle Alfonso XII, 3, 28014 Madrid, Spain
Received: 3 March 2016
Accepted: 18 May 2016
Abstract
The L1544 prestellar core has been observed as part of the ASAI IRAM Large Program at 3 mm. These observations led to the detection of many complex molecules. In this Letter, we report the detection of two lines, at 85.5 GHz (40,4–30,3) and 106.9 GHz (50,5–40,4), respectively, of the protonated carbon dioxide ion, HOCO+. We also report the tentative detection of the line at 100.4 GHz (50,5–40,4) of DOCO+. The non-LTE analysis of the detected lines shows that the HOCO+ emission originates in the external layer where non-thermal desorption of other species has previously been observed. Its abundance is (5 ± 2) × 10-11. Modelling of the chemistry involved in the formation and destruction of HOCO+ provides a gaseous CO2 abundance of 2 × 10⁻⁷ (with respect to H2) with an upper limit of 2 × 10⁻⁶.
Key words: astrochemistry / line: identification / molecular data / radiative transfer
© ESO, 2016
1. Introduction
The protonated form of CO2, HOCO+, was first identified in the Galactic centre molecular cloud SgrB2 by Thaddeus et al. (1981). The detection was then confirmed with the laboratory detection by Bogey et al. (1984). Minh et al. (1988) reported a survey towards 18 molecular clouds (dark clouds and active star-forming regions) and concluded that the HOCO+ ion was only detected towards SgrB2, and later towards SgrA (Minh et al. 1991). To date, this ion has been detected towards the Galactic centre, several translucent and dark clouds (Turner et al. 1999), a single low-mass Class 0 protostar (Sakai et al. 2008), and in the prototypical protostellar bow shock L1157-B1 (Podio et al. 2014). HOCO+ was first proposed by Herbst et al. (1977) as an indirect tracer of gas-phase CO2. Through a comparison of the abundances of HOCO+ with that of HCO+, the abundance of gas-phase CO2 relative to that of CO might be constrained. Carbon dioxide (CO2) is an important constituent of interstellar ices and has been widely detected in absorption towards infrared bright sources with the ISO and Spitzer telescopes. However, its formation mechanism is still not completely understood. Unfortunately, CO2 cannot be traced in the millimeter/submillimeter regime because it lacks a permanent dipole moment, therefore it can only be sought towards sources with a bright infrared continuum. In the solid phase, its abundance represents about 15–50% of solid H2O in quiescent molecular clouds, low-mass and high-mass protostars (Whittet et al. 1998, 2007, 2009; Öberg et al. 2011), and the ice abundances seem to be the highest for the coldest sources. The observed abundances of solid CO2 in the interstellar medium are a factor of 100 higher than in the gas phase (van Dishoeck et al. 1996; Boonman et al. 2003a), and the formation of CO2 is therefore assumed to proceed through reactions in the ices of interstellar dust grains. CO2 is readily produced in UV photo-processed CO-H2O laboratory ice, with an efficiency high enough to be driven by the cosmic-ray-induced UV field in dense interstellar regions (Watanabe & Kouchi 2002). Cosmic-ray processing of pure CO laboratory ice has also been shown to be a viable mechanism for CO2 production in the interstellar medium (Jamieson et al. 2006) and is an interesting solution given the large abundances of pure CO ice (Pontoppidan et al. 2003). Recently, Ioppolo et al. (2011) showed a correlation between the formation of CO2 and H2O (under laboratory conditions), which is consistent with the astronomical observation of solid CO2 in water-rich environments. Neill et al. (2014) performed a sensitive line survey of Sgr B2(N), and based on the HOCO+ species, they estimated a CO2/CO ratio in the colder external envelope of between 0.01−0.1, implying a CO2 gas-phase abundance of 10-6–10-5, consistent with the finding of Minh et al. (1988, 1991). Their lower limit to the CO2 gas-phase abundance of 10-6 relative to H2 indicates that the CO2 abundance in the gas is clearly enhanced, while most of the water is still frozen out in ices in the Sgr B2 envelope.
Properties of the observed HOCO+ and DOCO+ lines (Eup ≤ 30 K).
As part of the IRAM-30 m Large Program ASAI1 (Lefloch et al., in prep.), we carried out a highly sensitive, unbiased spectral survey of the molecular emission of the L1544 prestellar core with high spectral resolution. This source is a prototypical starless core in the Taurus molecular cloud complex (d ~ 140 pc) on the verge of the gravitational collapse (Caselli et al. 2002, and references within). It is characterised by a central high density (2 × 106 cm-3) and a low temperature (~7 K). We reported the detection of many oxygen bearing complex organic molecules produced through the release in the gas phase of methanol and ethene through non-thermal desorption processes (Vastel et al. 2014, hereafter Paper I). The sensitivity of these IRAM observations also led to the detection of the hyperfine structure of CH2CN (Vastel et al. 2015a). In the present study we report on the detection of the HOCO+ ion in the L1544 prestellar core, as well as a tentative detection of its deuterated form, DOCO+.
2. Observations and results
The observations were performed at the IRAM-30 m towards L1544 (α2000 = 05h04m17.21s,δ2000 = 25°10′42.8″) using the broad-band receiver EMIR at 3 mm, connected to an FTS spectrometer in its 50 kHz resolution mode. The beam of the observations is 29′′ and 23′′ at 85 and 106 GHz, respectively. Line intensities are expressed in units of main-beam brightness temperature (see Paper I for more details).
The frequencies and other spectroscopic parameters of the HOCO+ transitions have been retrieved from the JPL database2 from laboratory measurements by Bogey et al. (1988). Two lines of HOCO+ (the 40,4–30,3 and 50,5–40,4 at 85.531 and 106.913 GHz, respectively) lie in the frequency range covered by the ASAI survey for upper level energies lower than 30 K and were detected. Their spectra are shown in Fig. 1. Table 1 reports the spectroscopic parameters as well as the properties of the two detected lines, obtained by Gaussian fitting.
For the deuterated form of HOCO+, DOCO+, we used the JPL database with the spectroscopic parameters from Bogey et al. (1986, 1988). Three transitions lie in the frequency range for upper level energies lower than 30 K. In Fig. 2 and Table 1 we present the first tentative detection of this ion using the 50,5–40,4 transition, as well as the upper limits on the other transitions. The observed frequency (re-shifted by the 7.2 km s-1VLSR of L1544) is 100 359.81 MHz, compared to the computed 100 359.55 ± 0.035 MHz frequency provided by the JPL database. This is a 0.26 MHz difference and larger than the 0.035 MHz uncertainty quoted for this transition. However, the JPL and CDMS databases do not contain any other transition that could contaminate this frequency, so that we tentatively assign it to DOCO+. New spectroscopic measurements and observations with a lower root-mean square (rms 2 mK for a 10σ detection) are necessary to confirm the detection of the DOCO+ ion.
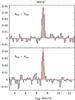 |
Fig. 1 Detected transitions of HOCO+ (Tmb). The red lines correspond to the LTE model (see text). |
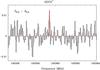 |
Fig. 2 Tentative detection of DOCO+ (Tmb). The red line corresponds to the LTE model (see text). The non-detection if the 80.3 GHz transition is consistent with the derived column density, taking the 5.2 mK rms into account. The modelled 80.3 GHz has the same intensity as the 100.4 GHz transition. |
3. Discussion
3.1. Origin and abundance of HOCO+ and DOCO+
Using the CASSIS3 software (Vastel et al. 2015b), we first performed a local thermodynamic equilibrium (LTE) analysis of the detected HOCO+ lines of Table 1, where we varied the excitation temperature and HOCO+ column density. The best fit of the two lines is obtained with a column density of 1.9 × 1011 cm-2 and an excitation temperature of 8.5 K (see Fig. 1). As a second step, we performed a non-LTE modelling using the LVG code by Ceccarelli et al. (2003) and the collision rates between HOCO+ and helium computed by Hammami et al. (2007), scaled by a factor of 1.37 to take the difference in mass of H2 into account. The collisional coefficients and spectroscopic data were retrieved from the BASECOL database4. The non-LTE LVG analysis shows a degeneracy in the density-temperature space. In order to lift this, we used the same method as in Paper I: we plotted the χ2 contours superimposed on the density-temperature curve of the physical structure of L1544 as derived by Caselli et al. (2012). The result is shown in Fig. 3. The two sets, LVG analysis and physical structure, cross for a diameter of the HOCO+ emitting region equal to about 100′′ (the emission is extended), and a HOCO+ column density of 2.5 × 1011 cm-2. This situation is similar to what has been observed for the methanol emission, which we described in Paper I. For both methanol and HOCO+, the emission originates in the outer layers of L1544 rather than in its dense inner core. The H2 column density of this outer layer is ~5 × 1021 cm-2 (see Paper I), which therefore yields a HOCO+ abundance of (5 ± 2) × 10-11 with respect to H2.
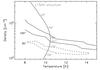 |
Fig. 3 χ2 contour plot of the density versus temperature obtained by the non-LTE LVG analysis of the two detected HOCO+ lines for two different source sizes and HOCO+ column densities: 30′′ and 6 × 1011 cm-2 (dashed line), 100′′ and 2.5 × 1011 cm-2 (solid line). The thick grey line shows the density-temperature structure of L1544 as derived by Caselli et al. (2012). The ticks along this line show the distance from the L1544 core center, in angular diameter. |
For DOCO+ we assumed the same excitation temperature as HOCO+, namely 8.5 K, and evaluated its column density to be ~5 × 1010 cm-2. Therefore, the upper limit on the DOCO+ abundance is ~10-11 and the deuteration ratio DOCO+/HOCO+ is lower than ~25%. We note that the upper limits on the 80.3 and 79.8 GHz DOCO+ transitions are compatible with this estimate.
3.2. Chemical modelling and CO2 gaseous abundance
The formation of the HOCO+ ion is linked to HCO+, and we can consider two main formation routes : OH + CO → CO2 followed by 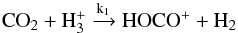 (1)
(1)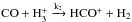 followed by
 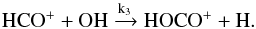 (2)The other relevant formation and destruction rates for HOCO+ and HCO+ are
 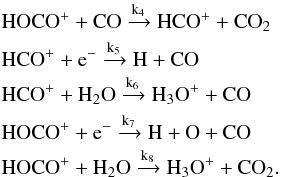 At steady state, we can therefore express the [HOCO+]/[HCO+] ratio as the following:
 ![Mathematical equation: \begin{equation} \frac{\rm [HOCO^+]}{\rm [HCO^+]} = \frac{k_1[{\rm H}_3^+][{\rm CO}_2]+k_3[{\rm HCO}^+][{\rm OH}]}{k_4[{\rm CO}]+k_7[e^-]+k_8[{\rm H_2O}]}\frac{k_5[e^-]+k_6[{\rm H_2O}]+k_3[{\rm OH}]}{k_2[{\rm CO}][{\rm H}_3^+]+k_4[{\rm HOCO+}][{\rm CO}]} \end{equation}](/articles/aa/full_html/2016/07/aa28427-16/aa28427-16-eq55.png) (3)HOCO+ was first proposed by Herbst et al. (1977) as an indirect tracer of gas-phase CO2 and was more recently used for this purpose by Sakai et al. (2008) and Neill et al. (2014). However, they neglected reaction 2 between HCO+ and OH and obtained a simple relation between [HOCO+]/[HCO+] and [CO2]/[CO] at steady state. The reaction rates (at 10 K) relevant to the formation and destruction of HOCO+ and HCO+ using the KIDA network5 are the following (in cm3 s-1): k1 = 1.90 × 10⁻⁹, k2 = 2.47 × 10⁻⁹, k3 = 5.56 × 10⁻⁹, k4 = 1.03 × 10⁻⁹, k5 = 2.93 × 10⁻⁶, k6 = 1.23 × 10⁻⁸, k7 = 7.14 × 10⁻⁶, and k8 = 1.14 × 10⁻⁸. Both reactions 1 and 2 must be taken into account, and the latter cannot be neglected, leading to an indirect estimate of the [CO2]/[CO] ratio from [HOCO+]/[HCO+]. In the centre of the prestellar core region, CO is highly depleted (Caselli et al. 1999) from the gas phase and is unlikely to produce HCO+ and therefore HOCO+. As a consequence, the HOCO+ ion might be visible in an external layer, where CO is released from the grain surfaces in the gas phase. HOCO+ depends on the cosmic ray ionisation rate ζCR, which governs the H
(3)HOCO+ was first proposed by Herbst et al. (1977) as an indirect tracer of gas-phase CO2 and was more recently used for this purpose by Sakai et al. (2008) and Neill et al. (2014). However, they neglected reaction 2 between HCO+ and OH and obtained a simple relation between [HOCO+]/[HCO+] and [CO2]/[CO] at steady state. The reaction rates (at 10 K) relevant to the formation and destruction of HOCO+ and HCO+ using the KIDA network5 are the following (in cm3 s-1): k1 = 1.90 × 10⁻⁹, k2 = 2.47 × 10⁻⁹, k3 = 5.56 × 10⁻⁹, k4 = 1.03 × 10⁻⁹, k5 = 2.93 × 10⁻⁶, k6 = 1.23 × 10⁻⁸, k7 = 7.14 × 10⁻⁶, and k8 = 1.14 × 10⁻⁸. Both reactions 1 and 2 must be taken into account, and the latter cannot be neglected, leading to an indirect estimate of the [CO2]/[CO] ratio from [HOCO+]/[HCO+]. In the centre of the prestellar core region, CO is highly depleted (Caselli et al. 1999) from the gas phase and is unlikely to produce HCO+ and therefore HOCO+. As a consequence, the HOCO+ ion might be visible in an external layer, where CO is released from the grain surfaces in the gas phase. HOCO+ depends on the cosmic ray ionisation rate ζCR, which governs the H and HCO+ abundances, and on the CO2 gaseous abundance when reaction (1) is more efficient than reaction (2). We considered the observations by Vastel et al. (2006), who measured a HCO+ column density of 4 × 1013 cm-2 in the external layer of L1544. If the bulk of the HCO+ emission arises from the outer layer, whose H2 column density is 5 × 1021 cm-2 (see Sect. 3.1), this yields a HCO+ abundance equal to ~8 × 10⁻⁹. Using the measured abundance of both HCO+ and HOCO+, we can now constrain the gaseous CO2 abundance. To this end, we ran the Nahoon gas-phase chemical model (Wakelam et al. 2015) and compared the predicted and measured abundance of HOCO+ and HCO+.
Nahoon computes the chemical evolution of a species as a function of time for a fixed temperature and density. The chemical network kida.uva.2014 contains 6992 unique chemical reactions and in total 7506 rate coefficients, and these reactions involve 489 different species. We built upon the model described in Paper I, that is, we considered a two-step model where in the first step we let the chemical composition reach steady state, and in the second step we injected a variable amount of CO2 in the gas phase and injected methanol (6 × 10⁻⁹ with respect to H atoms) and ethene (5 × 10⁻⁹), as in Paper I, to reproduce the detected COMs described there. The underlying hypothesis is that the gaseous CO2 is injected by the non-thermal desorption of iced CO2, as in the case of methanol (Paper I).
For the first step model, we adopted an elemental gaseous carbon abundance of 5 × 10⁻⁵ and a C/O ratio equal to 0.5, cosmic ionisation rate ζCR of 3 × 10-17 s-1, H density of 2 × 104 cm-3, temperature of 10 K and Av = 10 mag, as used in Paper I. The steady abundances of HOCO+ and HCO+ are 4 × 10-11 and 10-8, respectively; this is fully consistent with the observed ones. We note that a higher C/O ratio of unity will decrease to about 5 × 10-12 for HOCO+ and show no substantial change for HCO+. We used this two-step model to derive an upper limit to the quantity of injected CO2, taking the error bars on the observed HOCO+ into account. To stay below the upper value of the HOCO+ abundance (7 × 10-11), the quantity of injected CO2 in the gas-phase (through the second step) must be ≤2 × 10⁻⁶ (with respect to H2), namely ~4% of gaseous CO. We note that no CO2 injection in the gas phase is compatible with our HOCO+ observed abundance of 5 × 10-11, with a abundance (w.r.t. H2) from the gas-phase chemical modelling of 2 × 10⁻⁷. This value is consistent with the tentative gas-phase abundance average over the line of sight of four deeply embedded massive young stars, (van Dishoeck et al. 1996), the value found in the direction of Orion-IRc2/BN (Boonman et al. 2003a) as well as the average value found towards 8 massive protostars (Boonman et al. 2003b). The inferred abundance is also lower than the solid-state abundances of ~1–3 × 10⁻⁶ (Gerakines et al. 1999). Our study leads to the first indirect estimate of the CO2 presence in the earliest phases of low-mass star-forming regions, with no confusion between hot, warm and cold gas.
Putting together the previous observations in L1544 provides us with a rough estimate of the composition of the grain mantles of a prestellar core, which can only be guessed by the indirect process of non-thermal desorption. It turns out that the mantles should contain methanol, ethene and water, while it is not clear that frozen CO2 is present. Indeed, to convert the quoted abundances of gaseous into frozen species one has to take into account the relevant efficiency of the non-thermal desorption. Three mechanisms are invoked in the literature: FUV photo-desorption, cosmic-rays and chemical desorption. The latter seems to be very inefficient for the methanol release, based on laboratory experiments (Minissale et al. 2016). Cosmic-rays are suspected to be responsible for the re-injection into the gas phase of CO and other species with low binding energies via hot spot heating ~1000 K (Leger et al. 1985; Shen et al. 2004). However, this mechanism is not efficient in releasing more strongly bonded molecules. Another possibility is that frozen molecules are injected into the gas phase by the FUV photons created by the cosmic-ray interaction with H2 molecules. Very recent experimental works show for the FUV photo-desorption that methanol has a very low yield, ≤10-5 molecules/photon (Bertin et al. 2016), and that the FUV photons impinging on a methanol ice desorb fragments of the molecule, including CH3O, with the same efficiency. Our value for the methanol abundance and our upper limit on the CH3O abundance (respectively 6 × 10⁻⁹ and ≤1.5 × 10⁻¹⁰; Paper I) differ from these experiments, however. In laboratory experiments, CO2 is desorbed from a pure CO2 ice FUV illuminated with a yield of ~10-4 molecules/photon (Martín-Doménech et al. 2015). Assuming the FUV photo-desorption is the dominating mechanism and neglecting the dependence of the photo-desorption yield on the FUV illuminating field, our observations would then indicate a relative composition of the ice as follows: iced-CO2≤20 times iced methanol.
3.3. Deuteration of HOCO+
A high deuterium fractionation has been detected in the L1544 prestellar core where CO is depleted from the gas phase (Caselli et al. 1999). Caselli et al. (2003) detected a strong H2D+ emission, and Vastel et al. (2006) found that this ion is extended over the whole core, concluding that H2D+ is one of the main molecular ions in the central dense and cold region. Vastel et al. (2006) also detected a correlation between the H2D+ abundance and the ratio of DCO+/HCO+ and N2D+/N2H+ as well as the depletion factor, because H2D+ is the main driver for deuteration when CO is depleted onto the grain surfaces. L1544 is the site for many first detections in prestellar cores. For example, H2O has been detected with the Herschel/HIFI instrument (Caselli et al. 2012), but deuterated water is unfortunately not detected in this source, although an upper limit on the D/H ratio has been determined from deep observations with the APEX telescope (Quénard et al. 2016). The deuterated form of HOCO+ is likely produced through the high abundance of the H2D+ ion that appears extended in the L1544 core (Vastel et al. 2006), coupled with the non-thermal desorption of CO2 in the external layer. Both H2D+ and DCO+ detected in this core are expected to contribute to the production of the DOCO+, although no deuterated chemical network is available at the moment. The DCO+/HCO+ ratio in the external envelope is about 1%, which is much lower than the upper limit of 25% for the DOCO+/HOCO+ ratio using our tentative detection.
4. Conclusions
We detected two transitions of the HOCO+ ion at 85.5 and 106.9 GHz and obtained a tentative detection of a low energy level transition of its deuterated form at 100.3 GHz. Based on the HOCO+ detections, we were able to estimate the column density and abundance, which was compared to a chemical modelling, constraining the properties and formation of HOCO+ at the early stages towards collapse. The result shows that our detection is compatible with an emission in an external layer, with a CO2/H2 abundance of 2 × 10⁻⁷ and an upper limit of 2 × 10⁻⁶.
Astrochemical Surveys At Iram: http://www.oan.es/asai/
References
- Bertin, M., Romanzin, C., Doronin, M., et al. 2016, ApJ, 817, L12 [NASA ADS] [CrossRef] [Google Scholar]
- Bogey, M., Demuynck, C., & Destombes, J. L. 1984, A&A, 138, L11 [NASA ADS] [Google Scholar]
- Bogey, M., Demuynck, C., & Destombes, J. L. 1986, J. Chem. Phys., 84, 10 [NASA ADS] [CrossRef] [Google Scholar]
- Bogey, M., Demuynck, C., Destombes, J. L., & Krupnov, A. 1988, J. Mol. Struct., 190, 465 [NASA ADS] [CrossRef] [Google Scholar]
- Boonman, A. M. S., van Dishoeck, E. F., Lahuis, F., et al. 2003a, A&A, 399, 1047 [NASA ADS] [CrossRef] [EDP Sciences] [Google Scholar]
- Boonman, A. M. S., van Dishoeck, E. F., Lahuis, F., Doty, S. 2003b, A&A, 399, 1063 [NASA ADS] [CrossRef] [EDP Sciences] [Google Scholar]
- Caselli, P., Walmsley, C. M., Tafalla, M., et al. 1999, ApJ, 523, L165 [NASA ADS] [CrossRef] [Google Scholar]
- Caselli, P., Walmsley, C. M., Zucconi, A., et al. 2002, ApJ, 565, 331 [NASA ADS] [CrossRef] [Google Scholar]
- Caselli, P., van der Tak, F. F. S., Ceccarelli, C., & Bacmann, A. 2003, A&A, 403, L37 [NASA ADS] [CrossRef] [EDP Sciences] [Google Scholar]
- Caselli, P., Keto, E., Bergin, E. A., et al. 2012, ApJ, 759, L37 [Google Scholar]
- Ceccarelli, C., Maret, S., Tielens, A. G. G. M., et al. 2003, A&A, 410, 587 [NASA ADS] [CrossRef] [EDP Sciences] [Google Scholar]
- Gerakines, P. A., Whittet, D. C. B., Ehrenfreund, P., et al. 1999, ApJ, 522, 357 [NASA ADS] [CrossRef] [Google Scholar]
- Hammami, K., Lique, F., Jaïdane, N., et al. 2007, A&A, 462, 789 [NASA ADS] [CrossRef] [EDP Sciences] [Google Scholar]
- Herbst, E., Green, S., Thaddeus, P., & Klemperer, W. 1977, ApJ, 215, 503 [NASA ADS] [CrossRef] [Google Scholar]
- Ioppolo, S., van Boheemen, Y., Cuppen, H. M., et al. 2011, MNRAS, 413, 2281 [NASA ADS] [CrossRef] [Google Scholar]
- Jamieson, C. S., Mebel, A. M., & Kaiser, R. I. 2006, ApJS, 163, 184 [NASA ADS] [CrossRef] [Google Scholar]
- Leger, A., Jura, M., & Omont, A. 1985, A&A, 144, 147 [NASA ADS] [Google Scholar]
- Martín-Doménech, R., Manzano-Santamaría, J., Muñoz Caro, G. M., et al. 2015, A&A, 584, A14 [NASA ADS] [CrossRef] [EDP Sciences] [Google Scholar]
- Minh, Y. C., Irvine, W. M., & Ziurys, L. M. 1988, ApJ, 334, 175 [NASA ADS] [CrossRef] [Google Scholar]
- Minh, Y. C., Brewer, M. K., Irvine, W. M., et al. 1991, A&A, 244, 470 [NASA ADS] [Google Scholar]
- Minissale, M, Moudens, A, Baouche, S. et al. 2016, MNRAS, accepted [Google Scholar]
- Neill, J. L., Bergin, E. A., Lis, D. C., et al. 2014, ApJ, 789, 8 [NASA ADS] [CrossRef] [Google Scholar]
- Öberg, K. I., Boogert, A. C. A., Pontoppidan, K. M., et al. 2011, ApJ, 740, 109 [NASA ADS] [CrossRef] [Google Scholar]
- Podio, L., Lefloch, B., Ceccarelli, C., et al. 2014, A&A, 565, A64 [NASA ADS] [CrossRef] [EDP Sciences] [Google Scholar]
- Pontoppidan, K. M., Fraser, H. J., Dartois, E., et al. 2003, A&A, 408, 981 [NASA ADS] [CrossRef] [EDP Sciences] [Google Scholar]
- Quénard, D., Taquet, V., Vastel, C., et al. 2016, A&A, 585, A36 [NASA ADS] [CrossRef] [EDP Sciences] [Google Scholar]
- Sakai, N., Sakai, T., Aikawa, Y., & Yamamoto, S. 2008, ApJ, 675, L89 [NASA ADS] [CrossRef] [Google Scholar]
- Shen, C. J., Greenberg, J. M., Schutte, W. A., van Dishoeck, E. F. 2004, A&A, 415, 203 [NASA ADS] [CrossRef] [EDP Sciences] [Google Scholar]
- Thaddeus, P., Guelin, M., & Linke, R. A. 1981, ApJ, 246, L41 [NASA ADS] [CrossRef] [Google Scholar]
- Turner, B. E., Terzieva, R., & Herbst, E. 1999, ApJ, 518, 699 [NASA ADS] [CrossRef] [Google Scholar]
- van Dishoeck, E. F., Helmich, F. P., de Graauw, T., et al. 1996, A&A, 315, L349 [NASA ADS] [Google Scholar]
- Vastel, C., Caselli, P., Ceccarelli, C., et al. 2006, ApJ, 645, 1198 [NASA ADS] [CrossRef] [Google Scholar]
- Vastel, C., Ceccarelli, C., Lefloch, B., & Bachiller, R. 2014, ApJ, 795, L2 [Google Scholar]
- Vastel, C., Yamamoto, S., Lefloch, B., Bachiller, R. 2015a, A&A, 582, L3 [NASA ADS] [CrossRef] [EDP Sciences] [Google Scholar]
- Vastel, C., Bottinelli, S., Caux, E., et al. 2015b, SF2A-2015: Proc. Annual meeting of the French Society of Astronomy and Astrophysics, 313 [Google Scholar]
- Wakelam, V., Loison, J.-C., Herbst, E., et al. 2015, ApJS, 217, 20 [NASA ADS] [CrossRef] [Google Scholar]
- Watanabe, N., & Kouchi, A. 2002, ApJ, 567, 651 [NASA ADS] [CrossRef] [Google Scholar]
- Whittet, D. C. B., Gerakines, P. A., Tielens, A. G. G. M., et al. 1998, ApJ, 498, L159 [NASA ADS] [CrossRef] [Google Scholar]
- Whittet, D. C. B., Shenoy, S. S., Bergin, E. A, et al. 2007, ApJ, 655, 332 [NASA ADS] [CrossRef] [Google Scholar]
- Whittet, D. C. B., Cook, A. M., Chiar, J. E., et al. 2009, ApJ, 695, 94 [NASA ADS] [CrossRef] [Google Scholar]
All Tables
All Figures
|
Fig. 1 Detected transitions of HOCO+ (Tmb). The red lines correspond to the LTE model (see text). |
| In the text | |
|
Fig. 2 Tentative detection of DOCO+ (Tmb). The red line corresponds to the LTE model (see text). The non-detection if the 80.3 GHz transition is consistent with the derived column density, taking the 5.2 mK rms into account. The modelled 80.3 GHz has the same intensity as the 100.4 GHz transition. |
| In the text | |
|
Fig. 3 χ2 contour plot of the density versus temperature obtained by the non-LTE LVG analysis of the two detected HOCO+ lines for two different source sizes and HOCO+ column densities: 30′′ and 6 × 1011 cm-2 (dashed line), 100′′ and 2.5 × 1011 cm-2 (solid line). The thick grey line shows the density-temperature structure of L1544 as derived by Caselli et al. (2012). The ticks along this line show the distance from the L1544 core center, in angular diameter. |
| In the text | |
Current usage metrics show cumulative count of Article Views (full-text article views including HTML views, PDF and ePub downloads, according to the available data) and Abstracts Views on Vision4Press platform.
Data correspond to usage on the plateform after 2015. The current usage metrics is available 48-96 hours after online publication and is updated daily on week days.
Initial download of the metrics may take a while.