Fig. 3
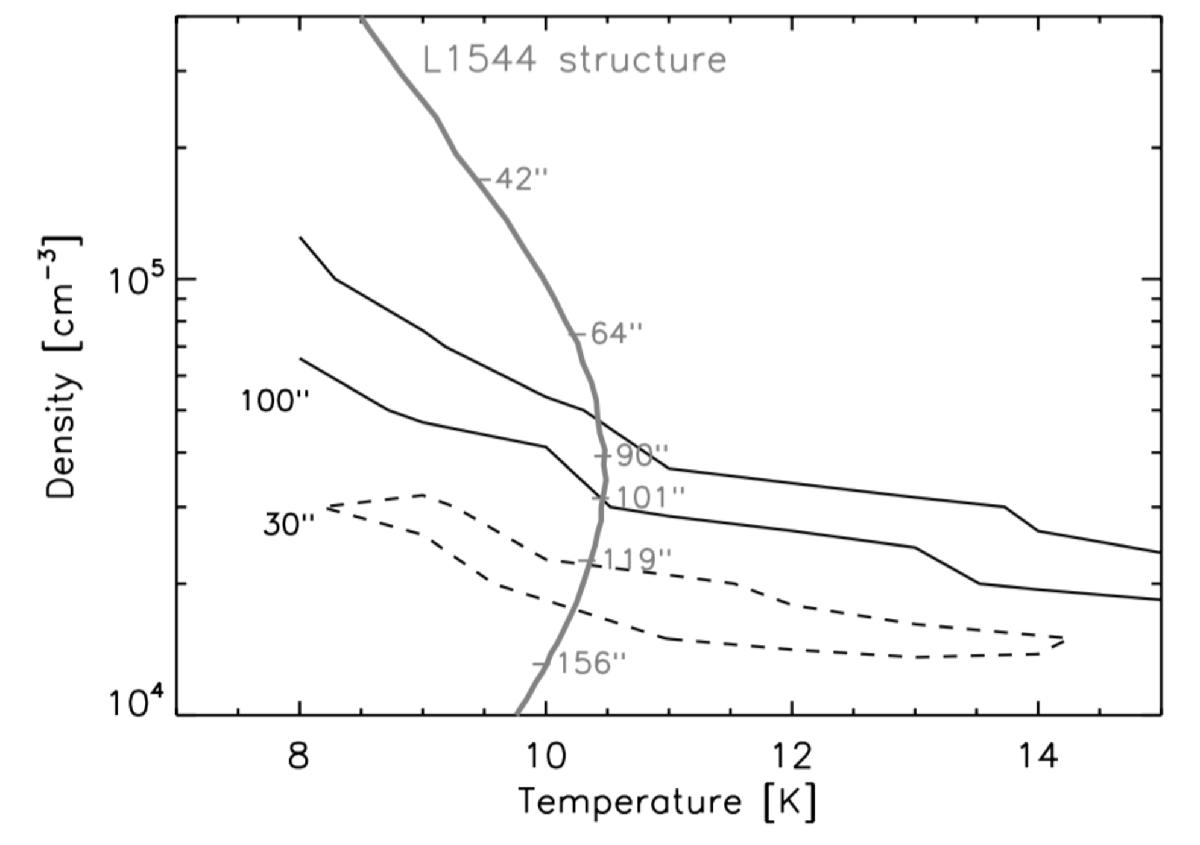
χ2 contour plot of the density versus temperature obtained by the non-LTE LVG analysis of the two detected HOCO+ lines for two different source sizes and HOCO+ column densities: 30′′ and 6 × 1011 cm-2 (dashed line), 100′′ and 2.5 × 1011 cm-2 (solid line). The thick grey line shows the density-temperature structure of L1544 as derived by Caselli et al. (2012). The ticks along this line show the distance from the L1544 core center, in angular diameter.
Current usage metrics show cumulative count of Article Views (full-text article views including HTML views, PDF and ePub downloads, according to the available data) and Abstracts Views on Vision4Press platform.
Data correspond to usage on the plateform after 2015. The current usage metrics is available 48-96 hours after online publication and is updated daily on week days.
Initial download of the metrics may take a while.