Fig. 1
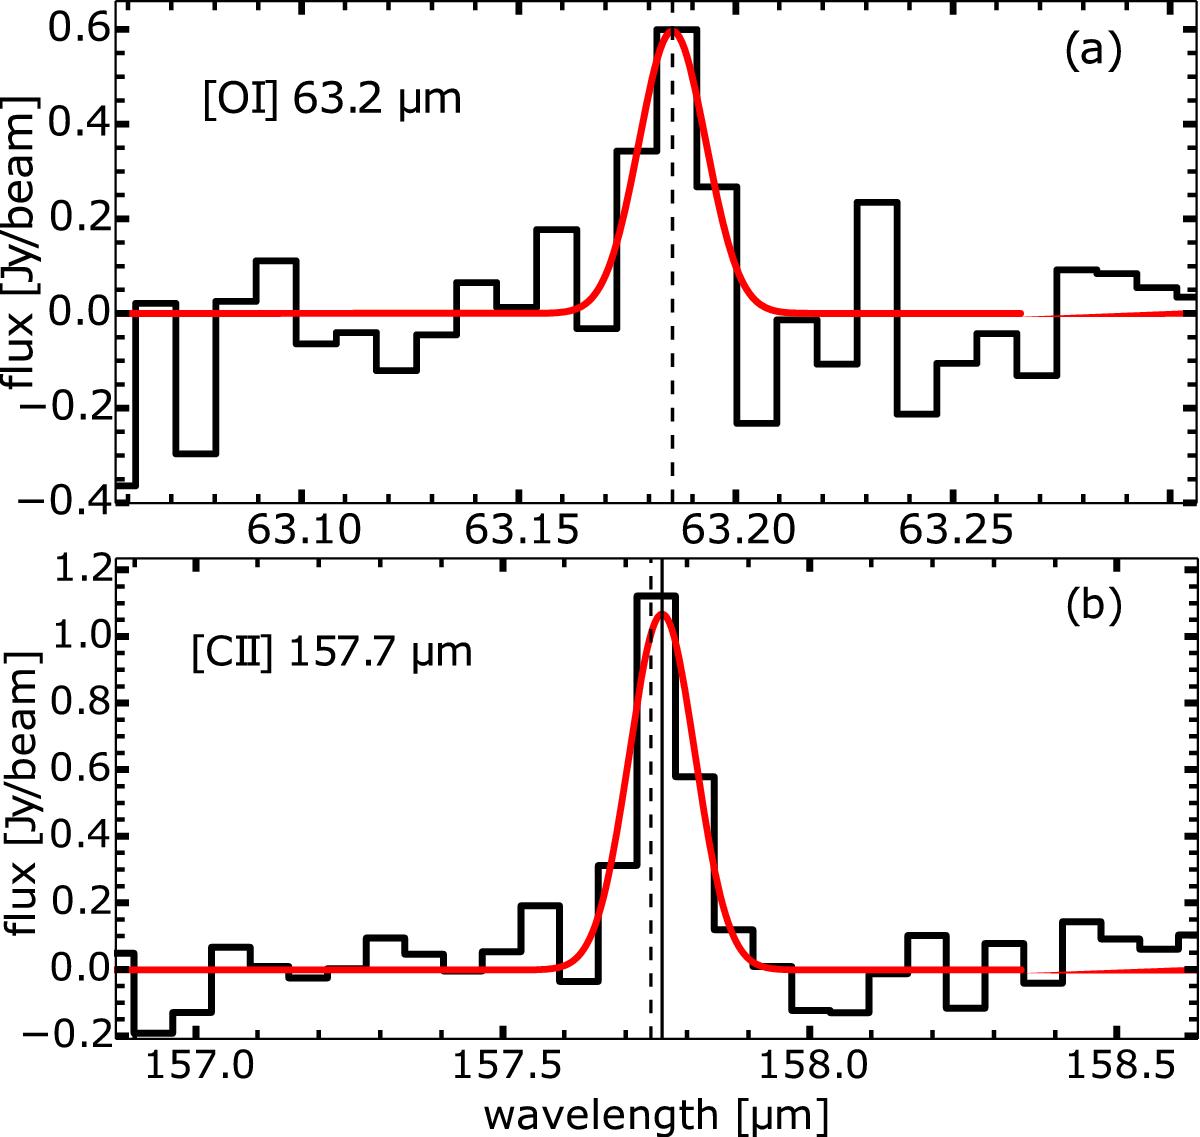
Emission lines observed from β Pic with fitted Gaussian profiles overplotted. The spectra were continuum subtracted and rebinned. The vertical dashed line shows the expected wavelength of the emission line. The measured fluxes are reported in Table 1. a): [O i] 63.2 μm emission line observed by the central spaxel (12) of PACS. The wavelength scale is in the local standard of rest frame. b): [C ii] 157.7 μm emission line of the central spaxel. The unbroken vertical line shows the fitted centre of the emission line.
Current usage metrics show cumulative count of Article Views (full-text article views including HTML views, PDF and ePub downloads, according to the available data) and Abstracts Views on Vision4Press platform.
Data correspond to usage on the plateform after 2015. The current usage metrics is available 48-96 hours after online publication and is updated daily on week days.
Initial download of the metrics may take a while.