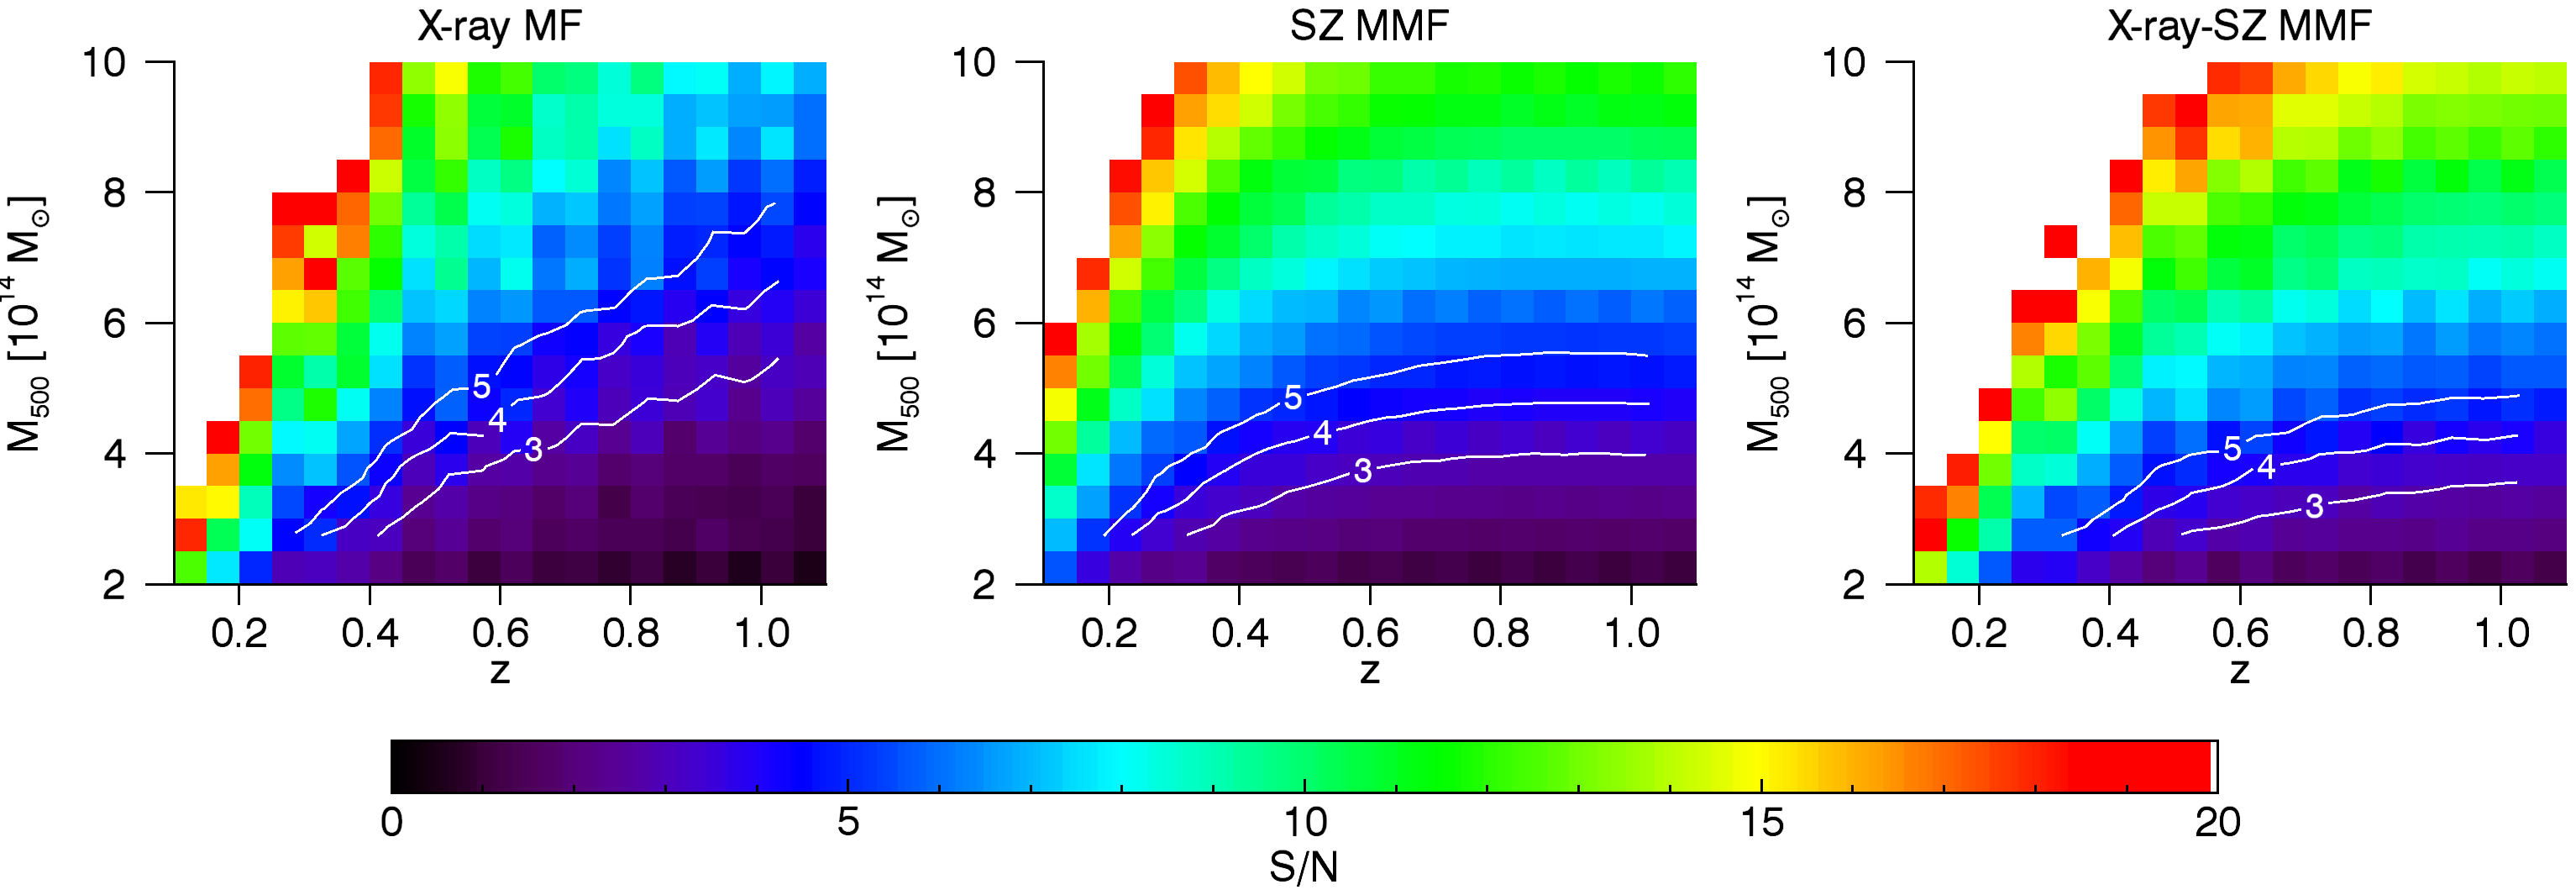
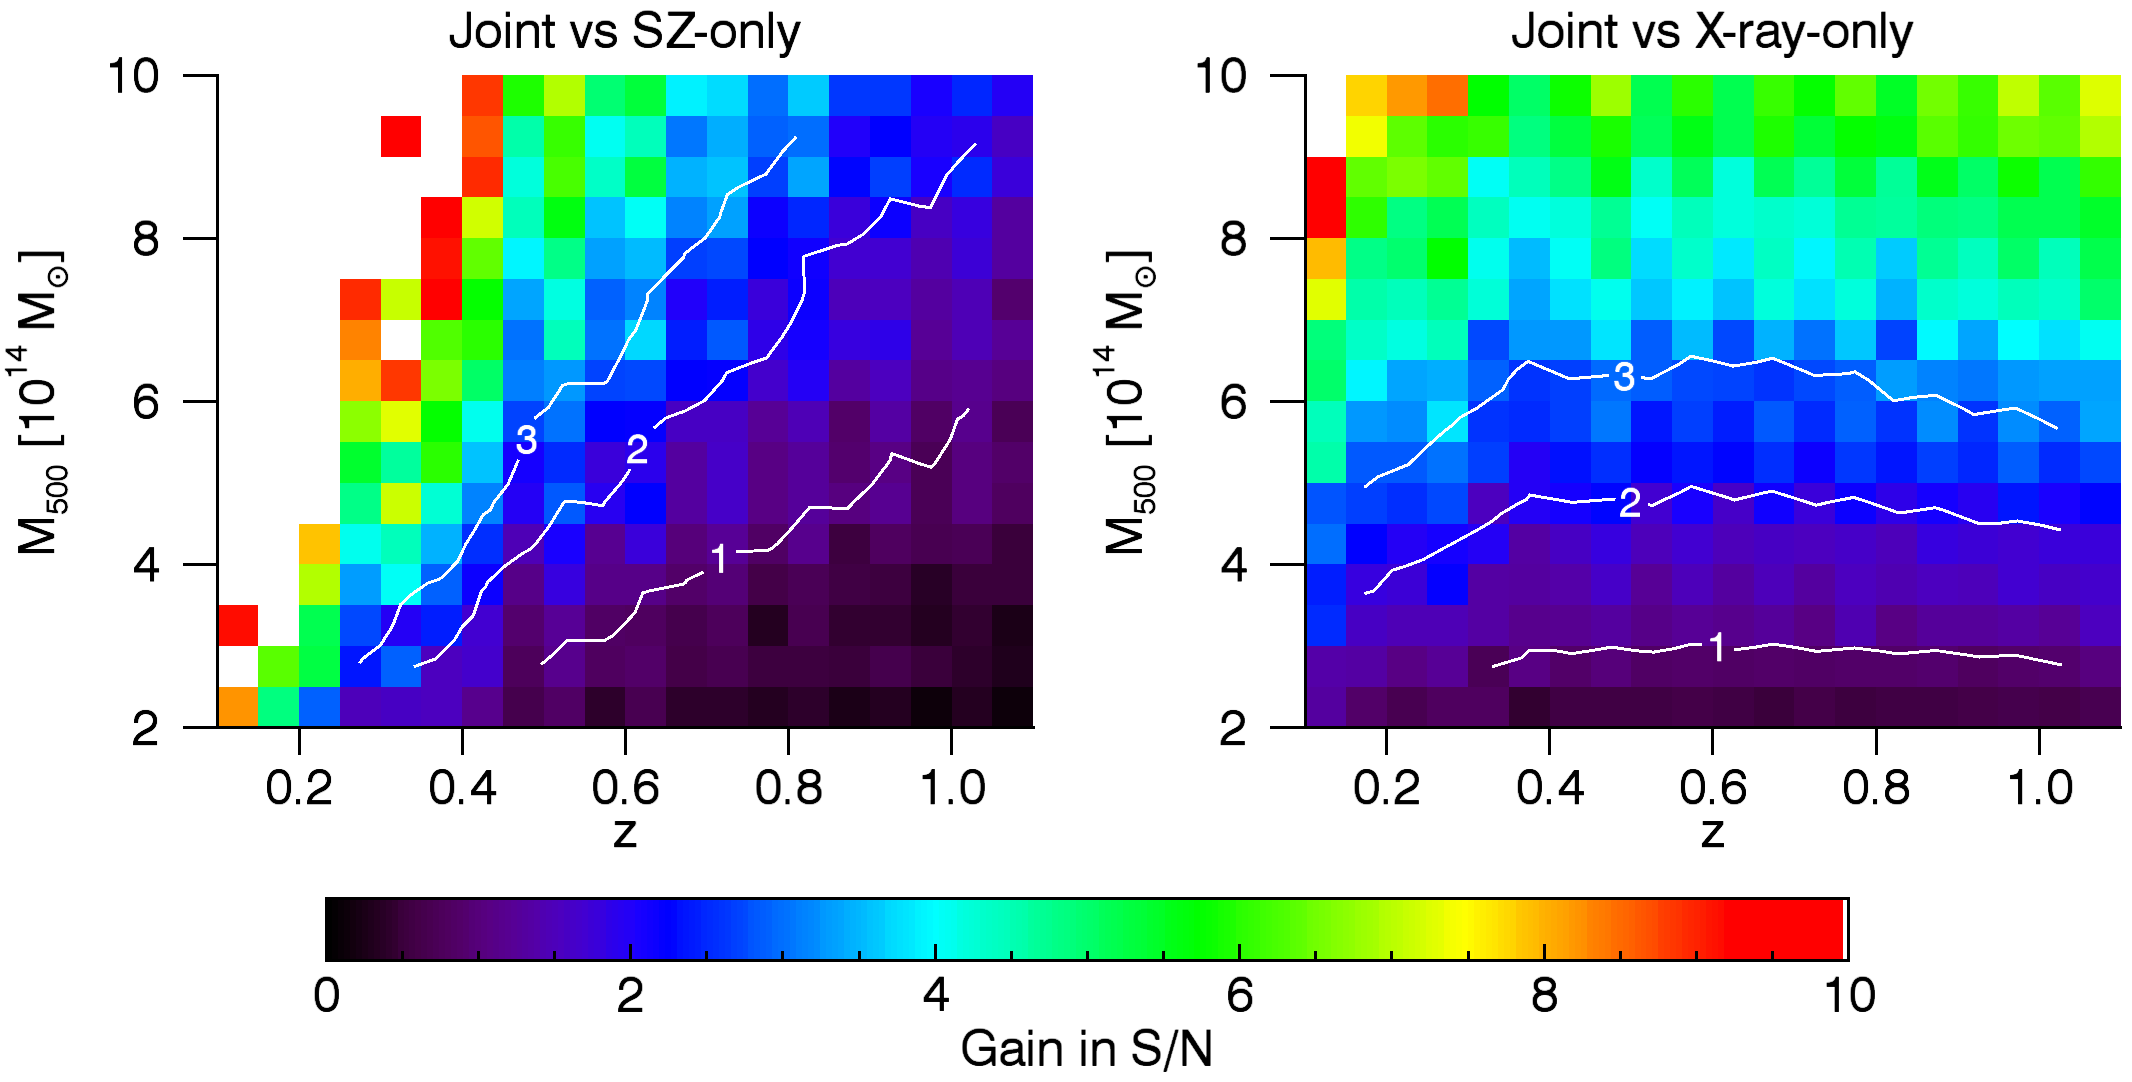
Fig. 7
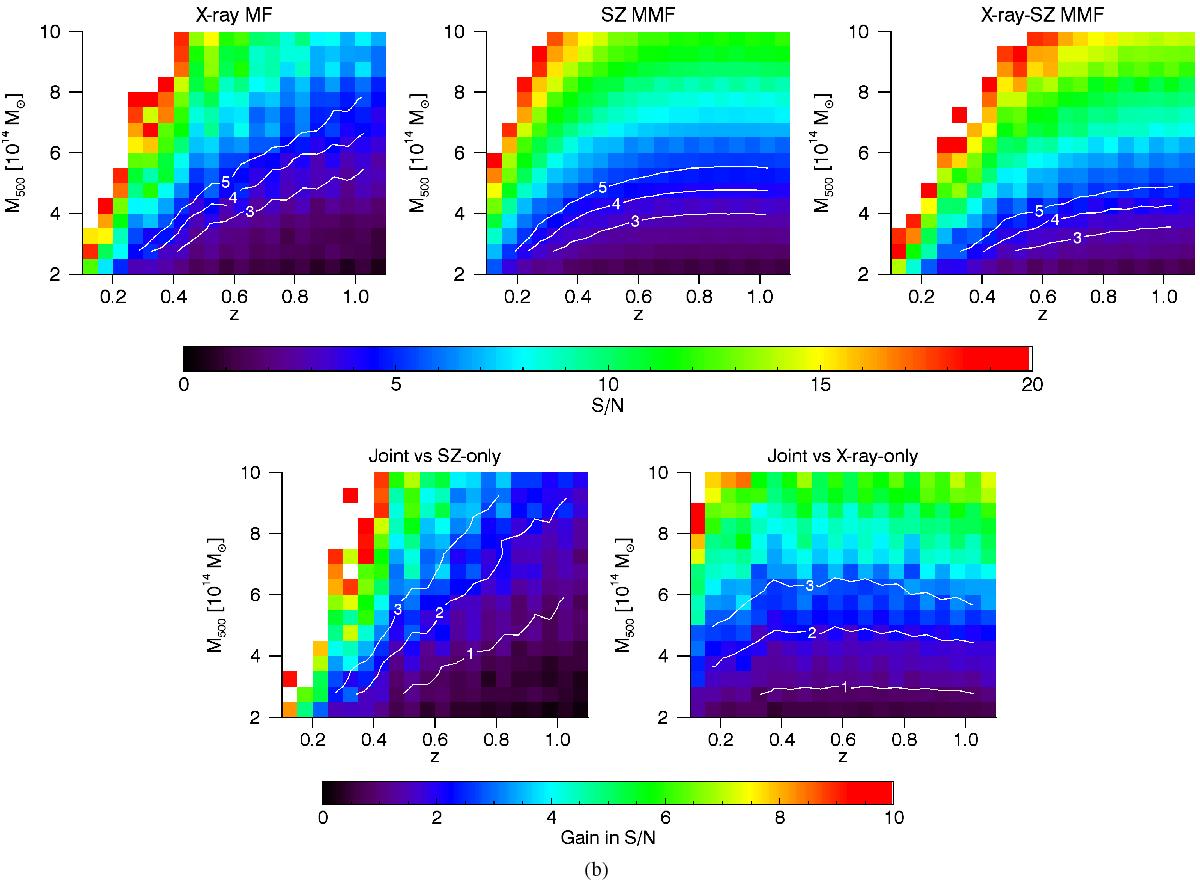
Top panels: S/N of the clusters extracted with the proposed X-ray matched filter (left panel), the classical SZ MMF (middle panel), and the proposed X-ray-SZ MMF (right panel), averaged in different mass and redshift bins. White lines indicate smoothed isocontours corresponding to a S/N of 3, 4, and 5. White bins indicate a S/N greater than 20. Bottom panels: average difference between the S/N obtained with the proposed X-ray-SZ MMF and the S/N obtained with SZ MMF (left panel) and the X-ray MF (right panel). White lines indicate smoothed isocontours corresponding to a difference in S/N of 1, 2, and 3. White bins indicate a difference in S/N greater than 10.
Current usage metrics show cumulative count of Article Views (full-text article views including HTML views, PDF and ePub downloads, according to the available data) and Abstracts Views on Vision4Press platform.
Data correspond to usage on the plateform after 2015. The current usage metrics is available 48-96 hours after online publication and is updated daily on week days.
Initial download of the metrics may take a while.