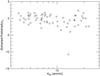
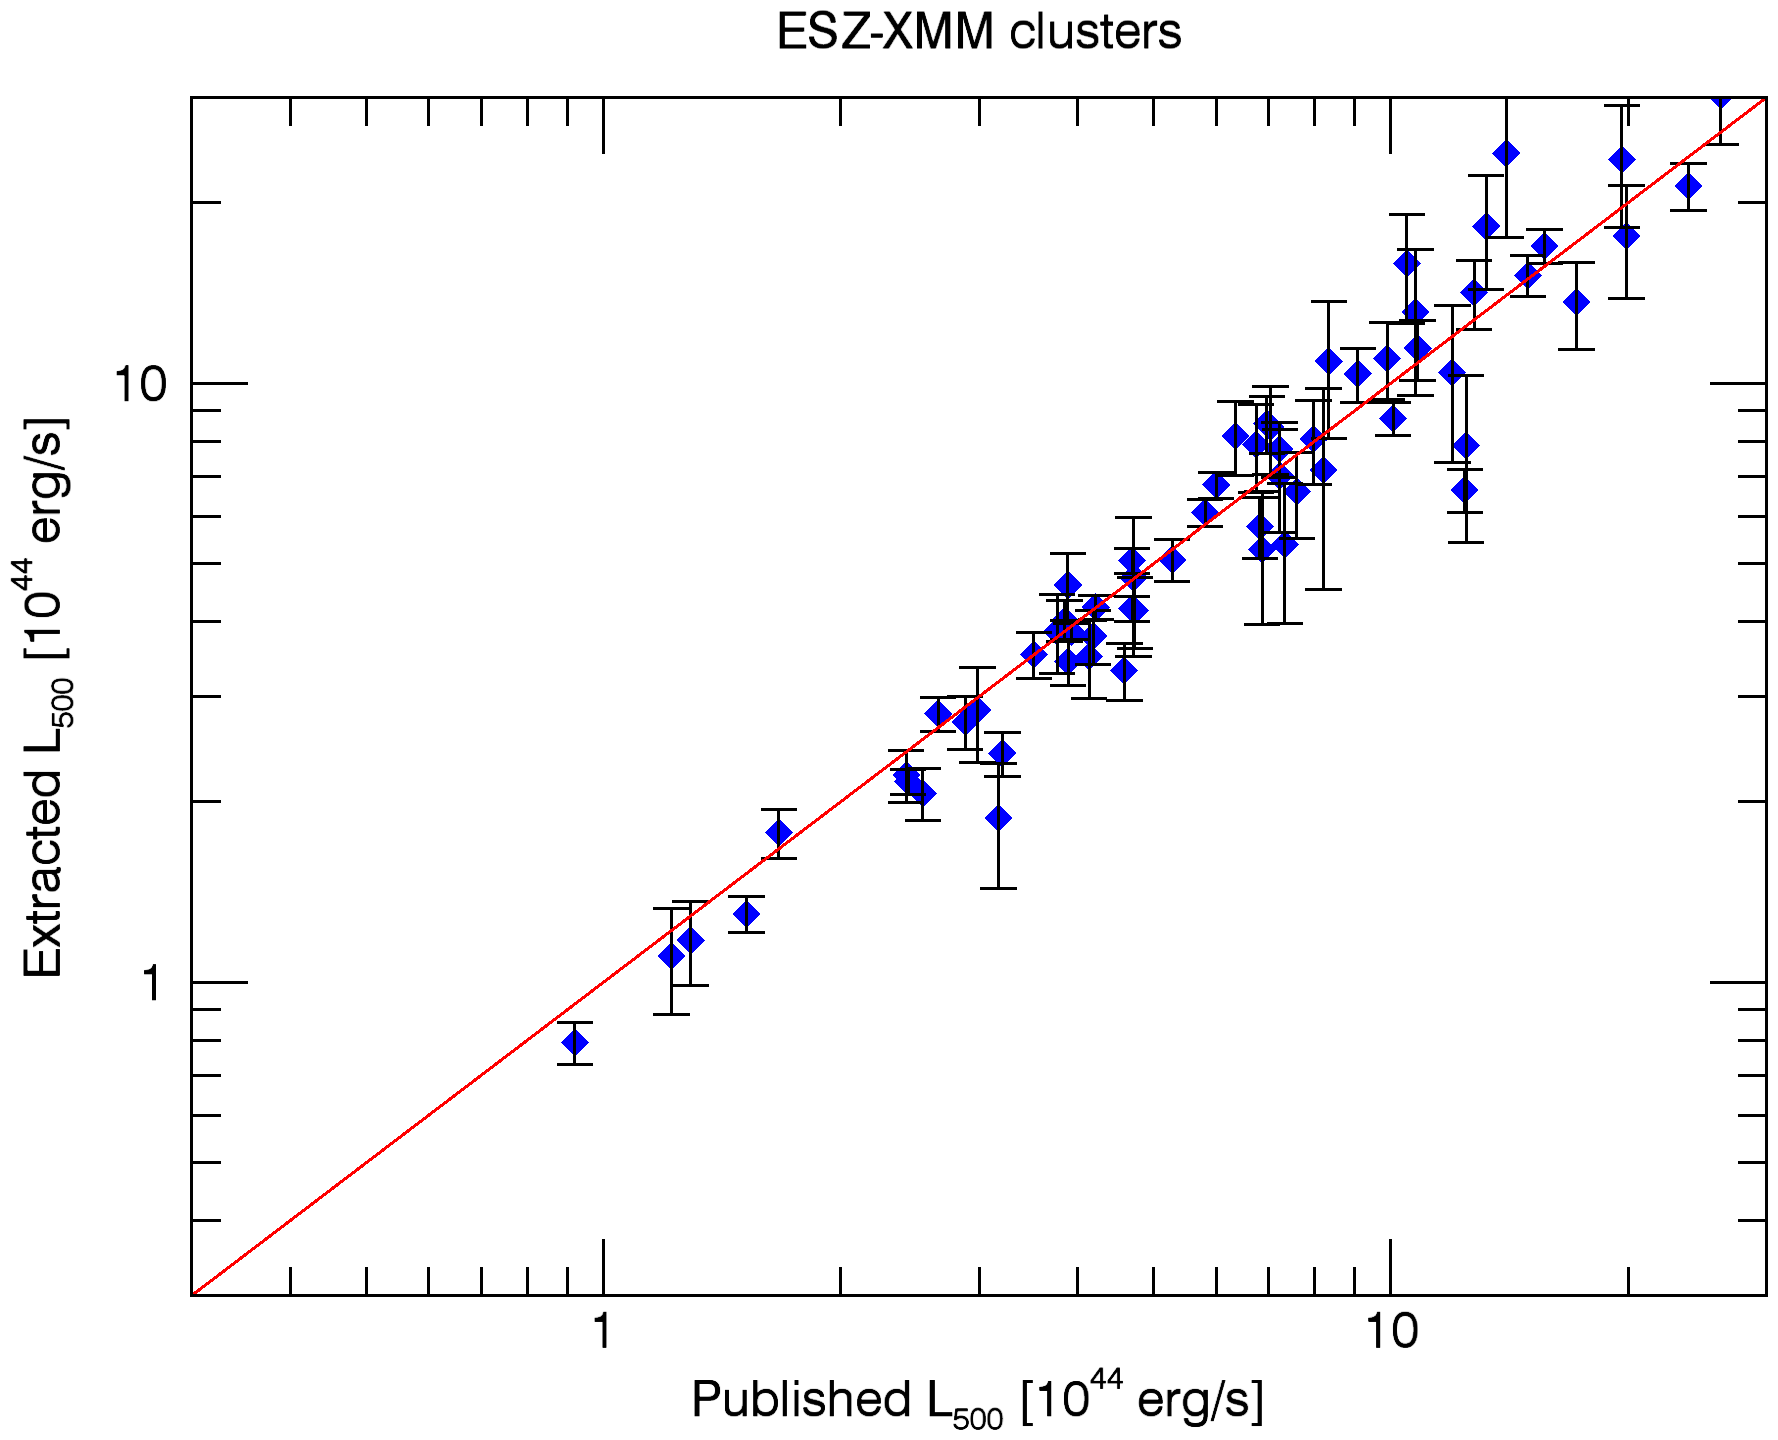
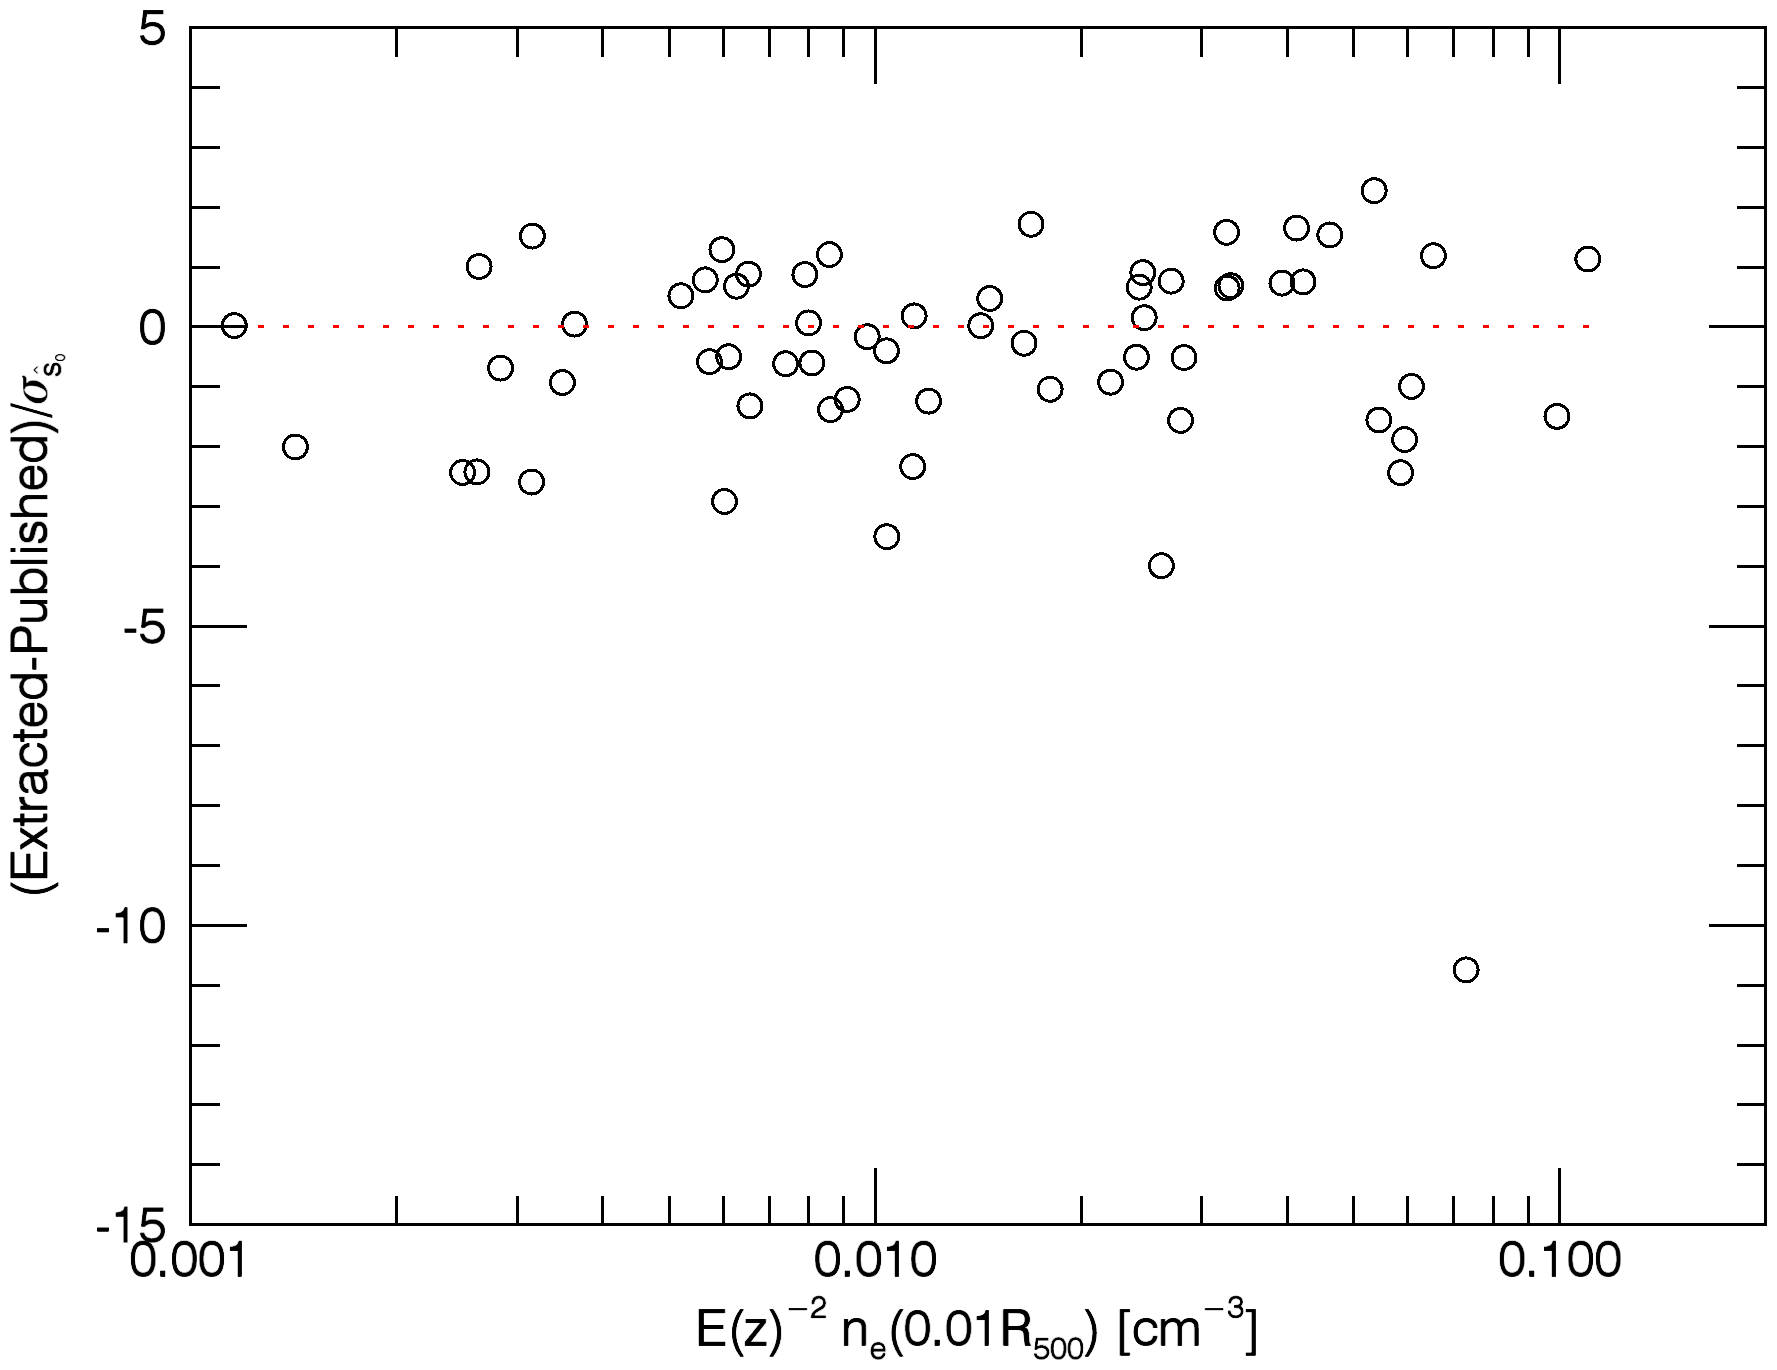
Fig. 5
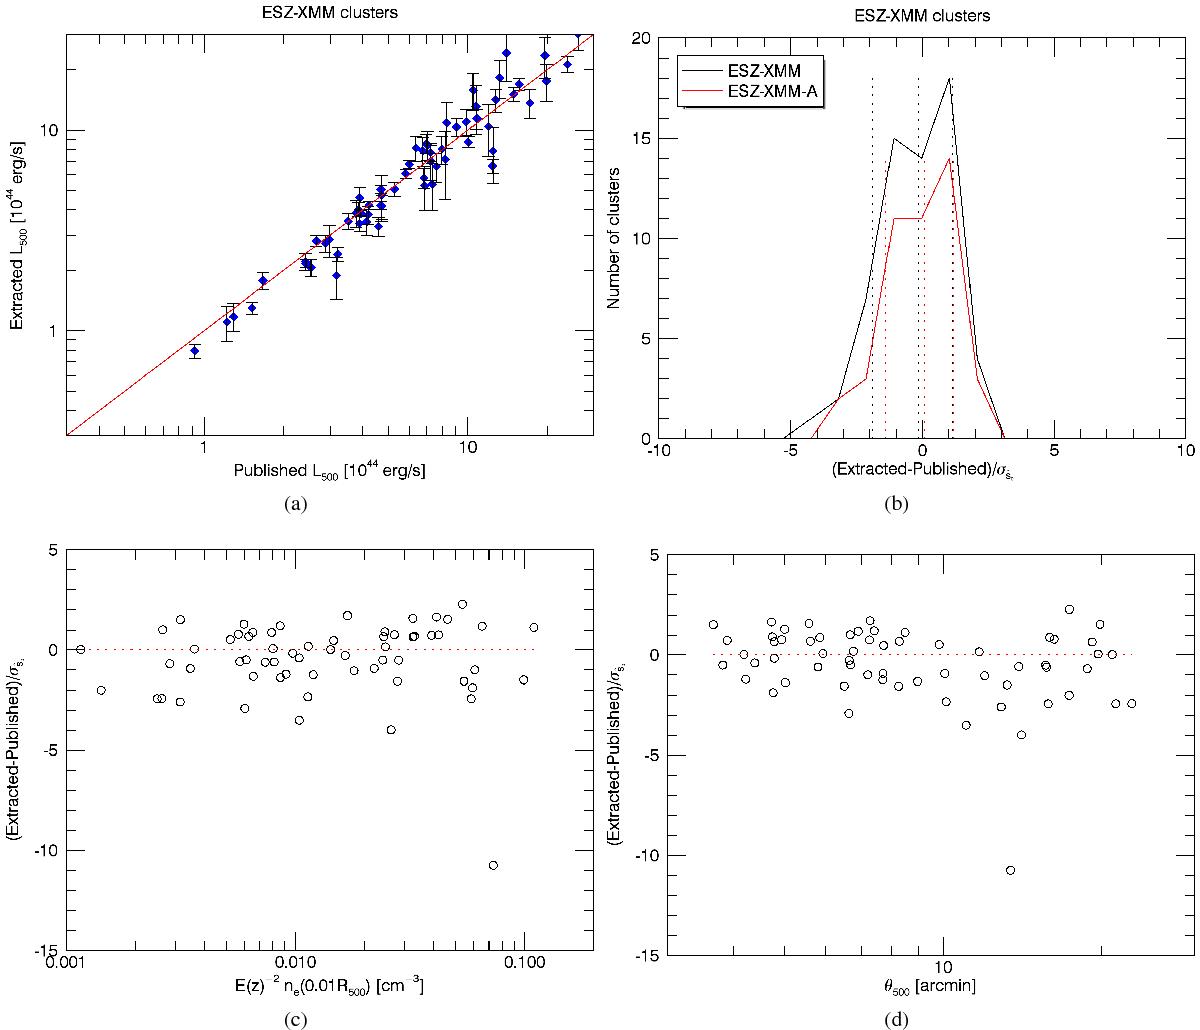
Photometry results of the extraction of the ESZ-XMM clusters using the proposed X-ray matched filter with the individual cluster profiles and assuming the position and size of the clusters are known. The four panels are analogous to those in Fig. 4. The top right panel includes in this case two histograms, one corresponding to the whole ESZ-XMM sample (black) and another corresponding to the ESZ-XMM-A subsample (red), which includes the clusters well within the XMM-Newton field of view.
Current usage metrics show cumulative count of Article Views (full-text article views including HTML views, PDF and ePub downloads, according to the available data) and Abstracts Views on Vision4Press platform.
Data correspond to usage on the plateform after 2015. The current usage metrics is available 48-96 hours after online publication and is updated daily on week days.
Initial download of the metrics may take a while.