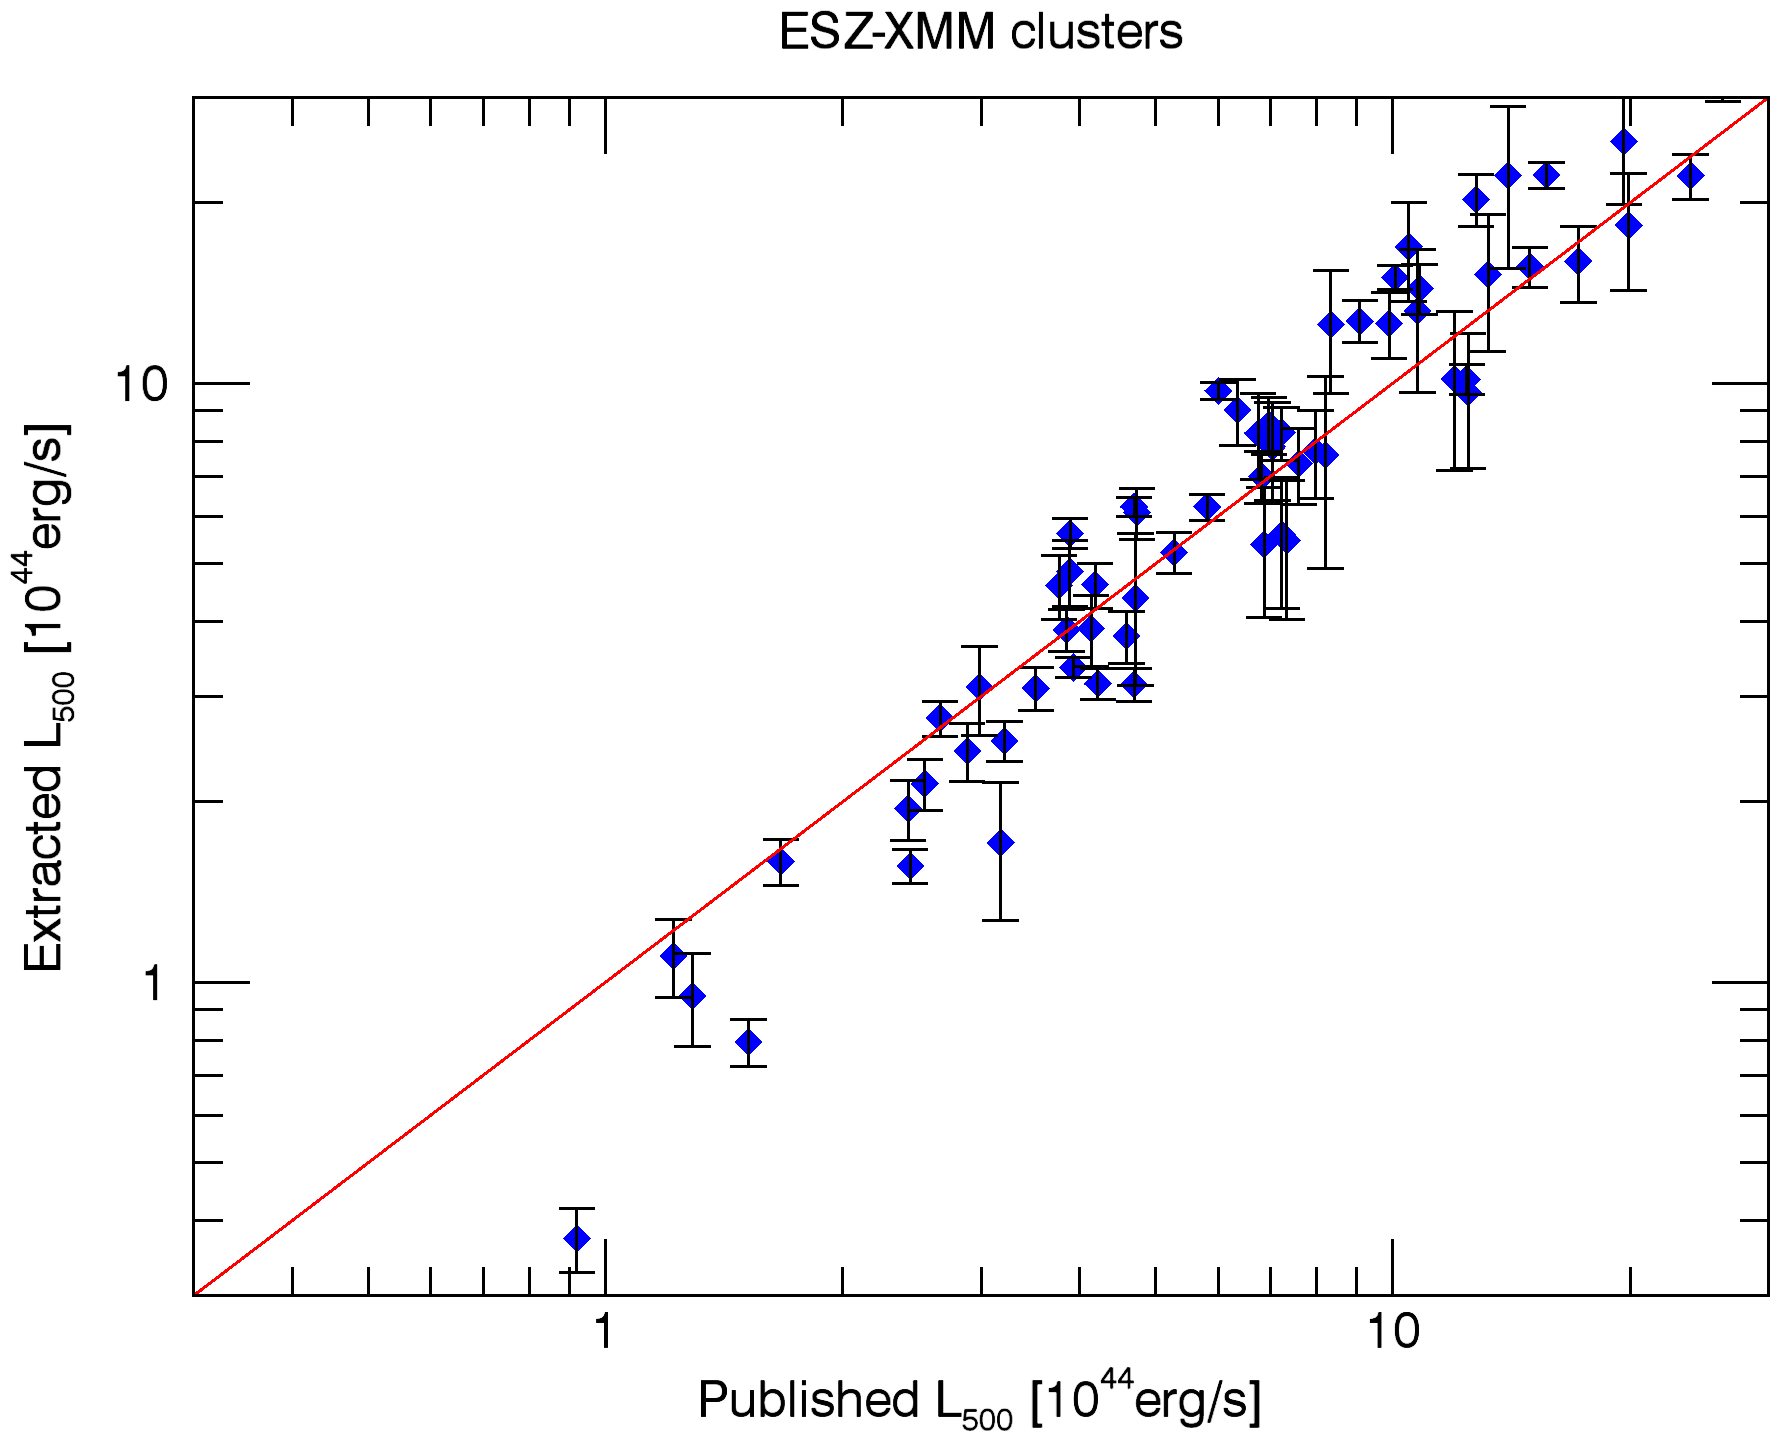
Fig. 4
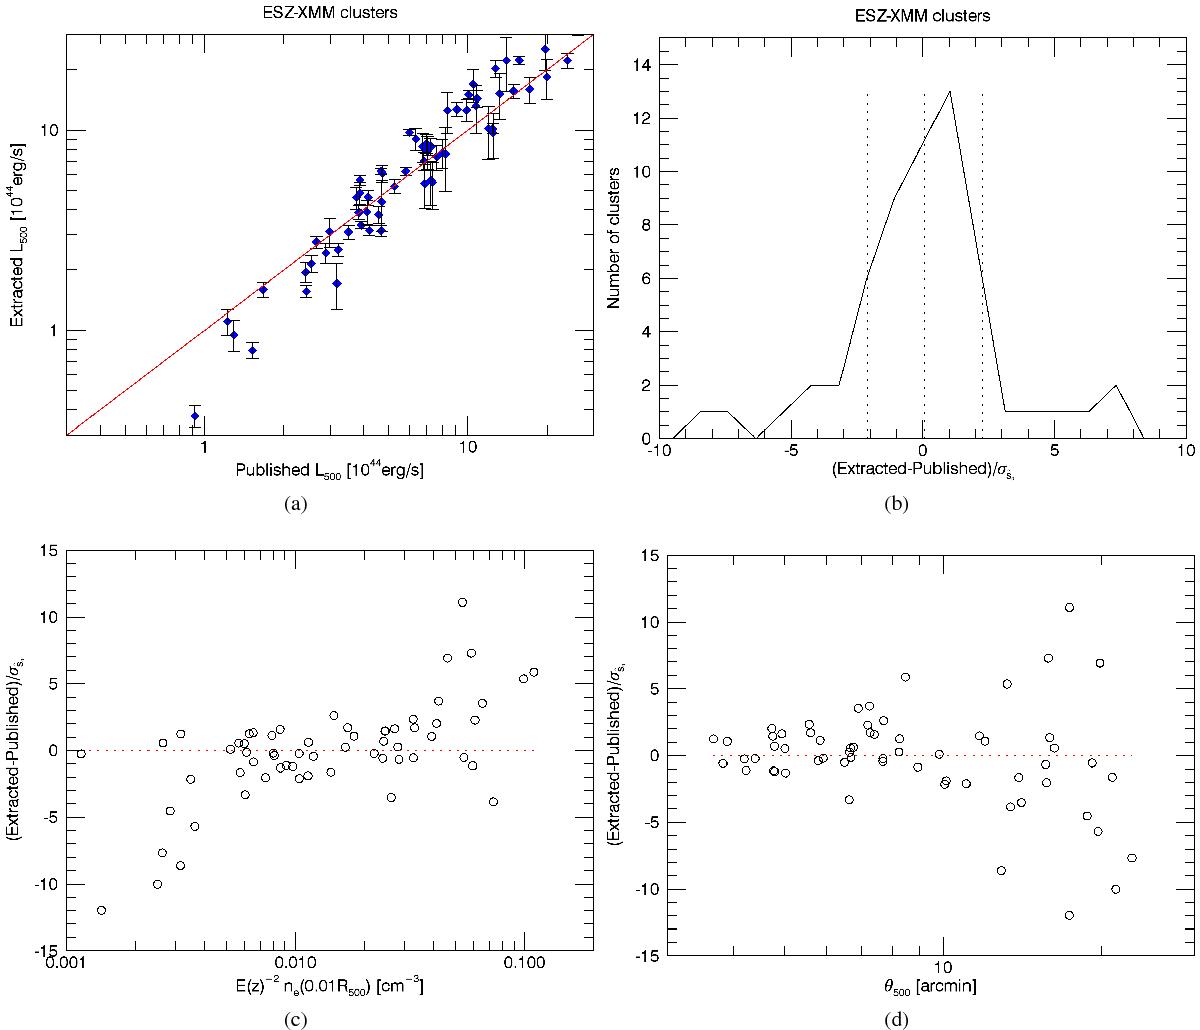
Photometry results of the extraction of the ESZ-XMM clusters using the proposed X-ray matched filter with the average cluster profile and assuming the position and size of the clusters are known. Top left panel: extracted versus published L500. The error bars correspond to the estimated ![]() (scaled to L500 units). Top right panel: histogram of the difference between the extracted and the published L500, divided by the estimated
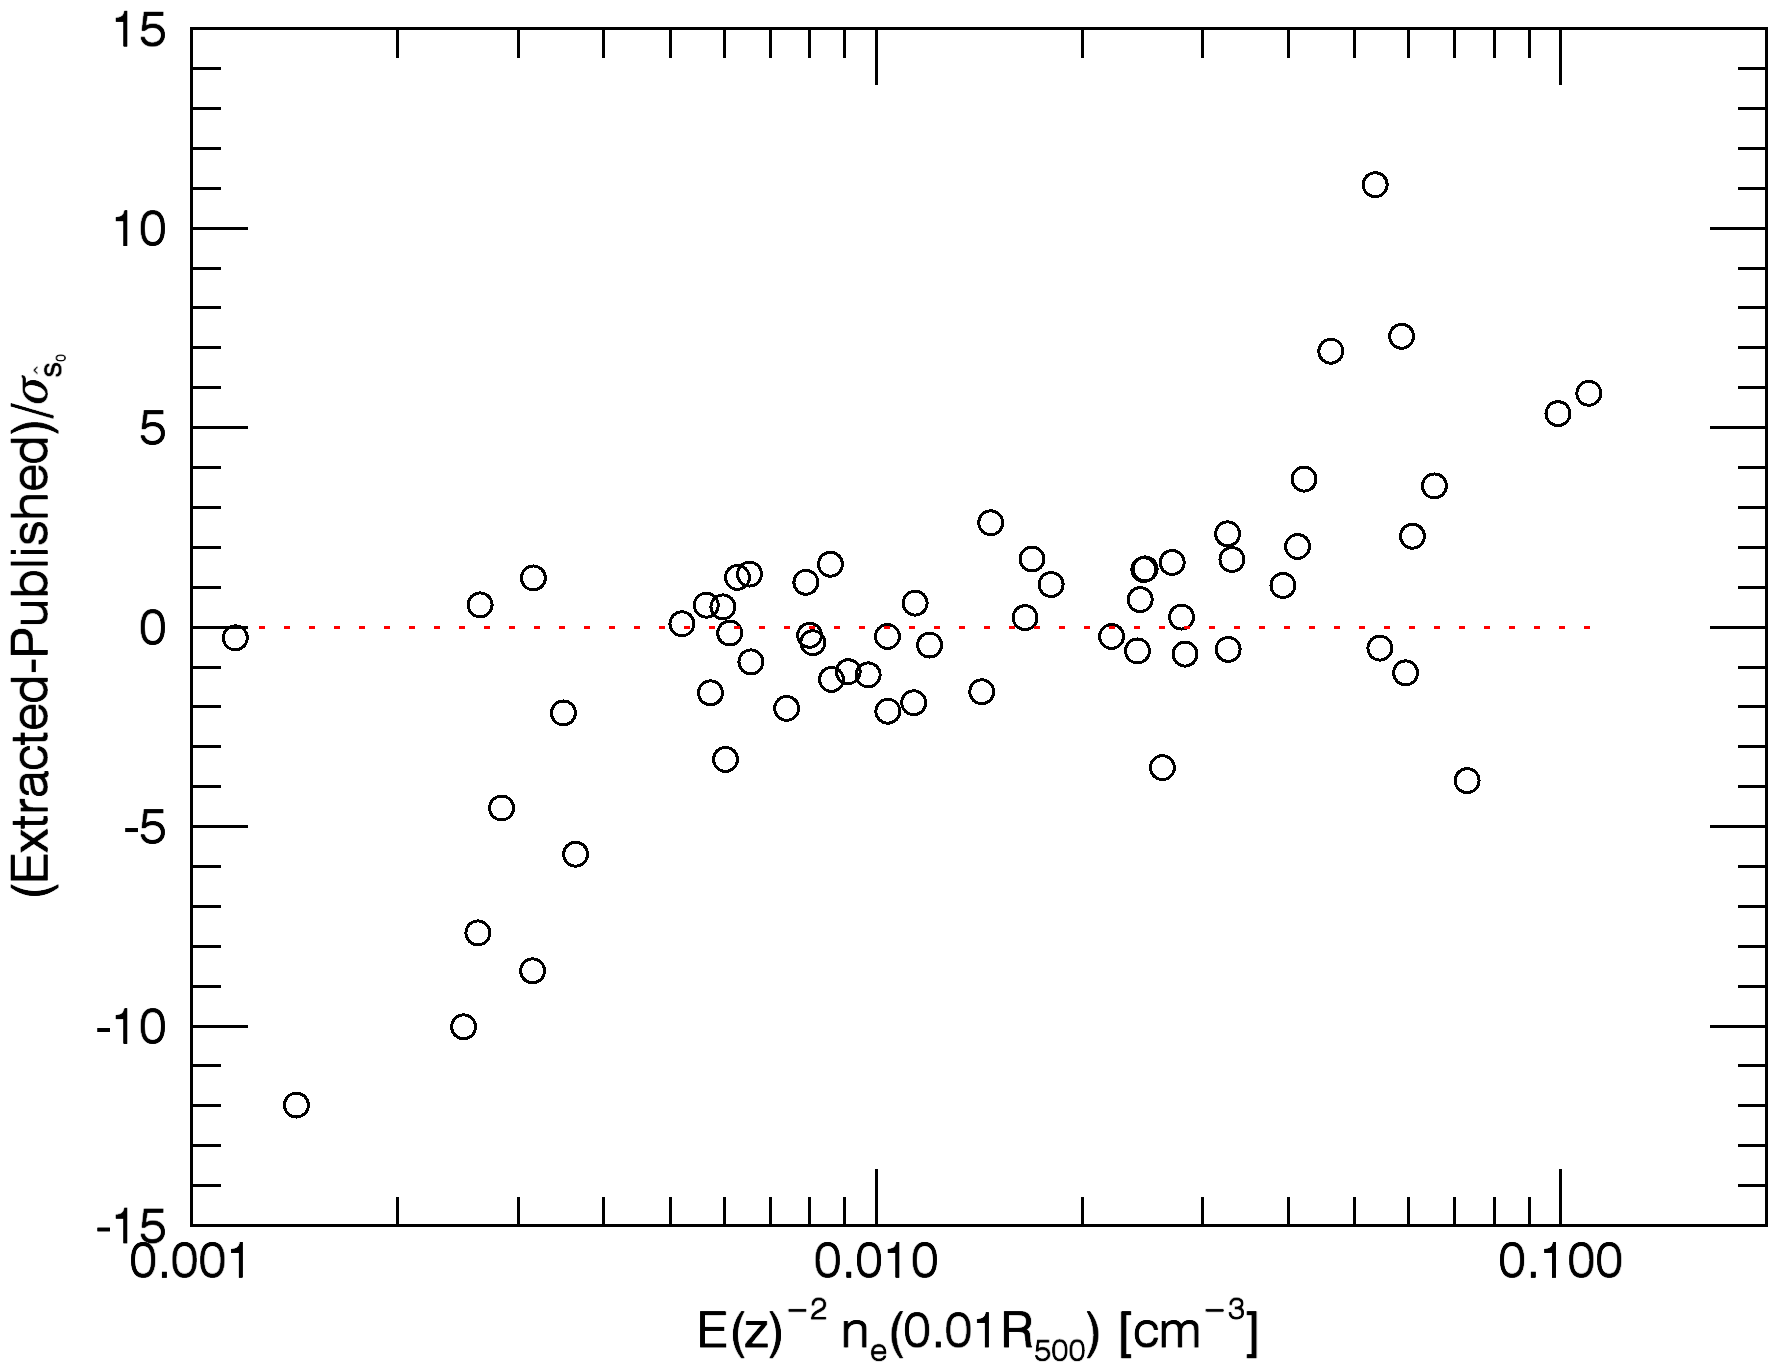
(scaled to L500 units). Top right panel: histogram of the difference between the extracted and the published L500, divided by the estimated ![]() . The central vertical line shows the median value, whereas the other two vertical lines indicate the region inside which 68% of the clusters lie. Bottom panels: difference between the extracted and the published L500, divided by the estimated
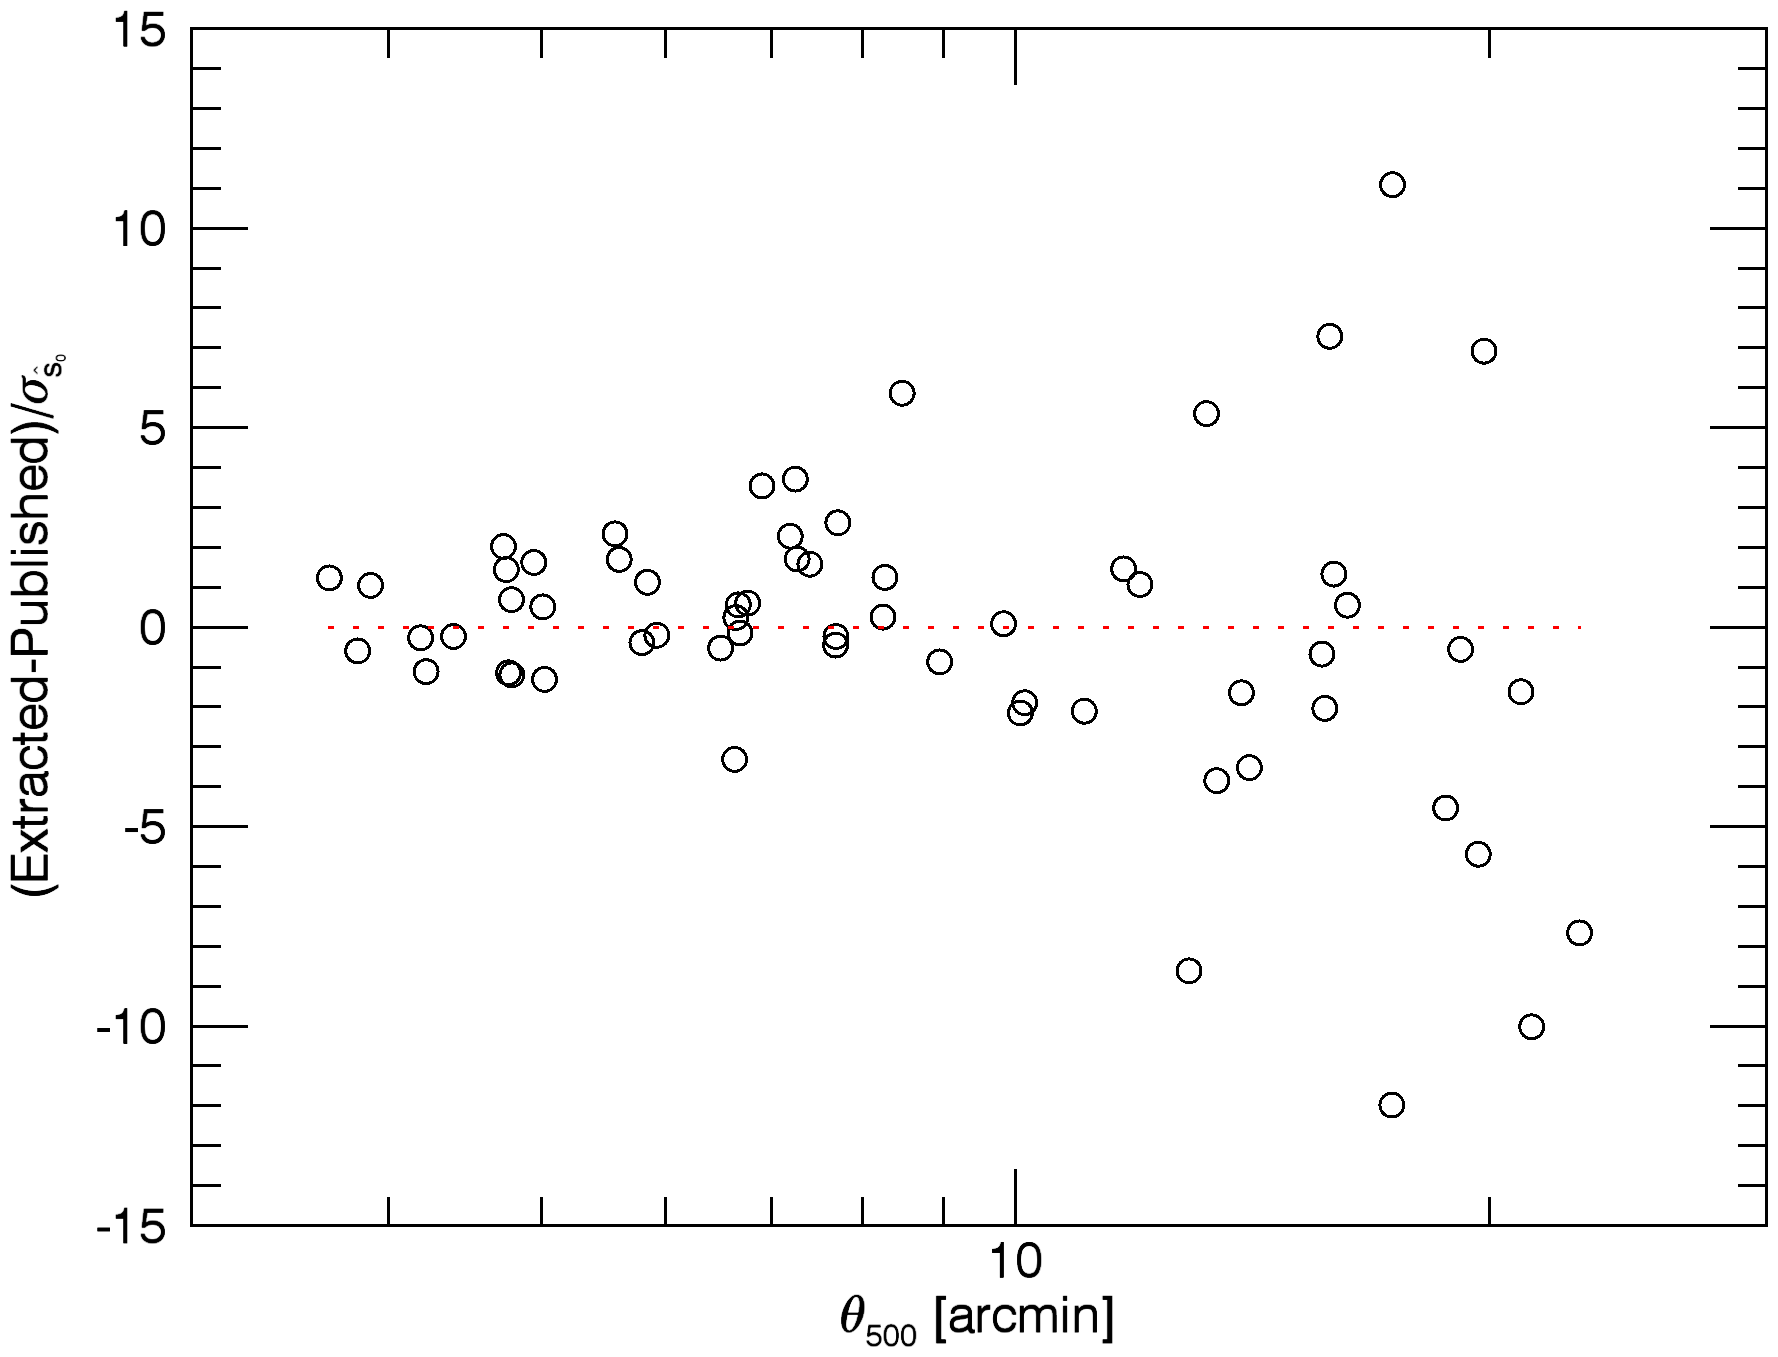
. The central vertical line shows the median value, whereas the other two vertical lines indicate the region inside which 68% of the clusters lie. Bottom panels: difference between the extracted and the published L500, divided by the estimated ![]() as a function of c) the scaled central density of the cluster (at 0.01 R500), which is an indicator of the shape of the cluster profile; and d) the size θ500 of the cluster.
as a function of c) the scaled central density of the cluster (at 0.01 R500), which is an indicator of the shape of the cluster profile; and d) the size θ500 of the cluster.
Current usage metrics show cumulative count of Article Views (full-text article views including HTML views, PDF and ePub downloads, according to the available data) and Abstracts Views on Vision4Press platform.
Data correspond to usage on the plateform after 2015. The current usage metrics is available 48-96 hours after online publication and is updated daily on week days.
Initial download of the metrics may take a while.