Fig. 3
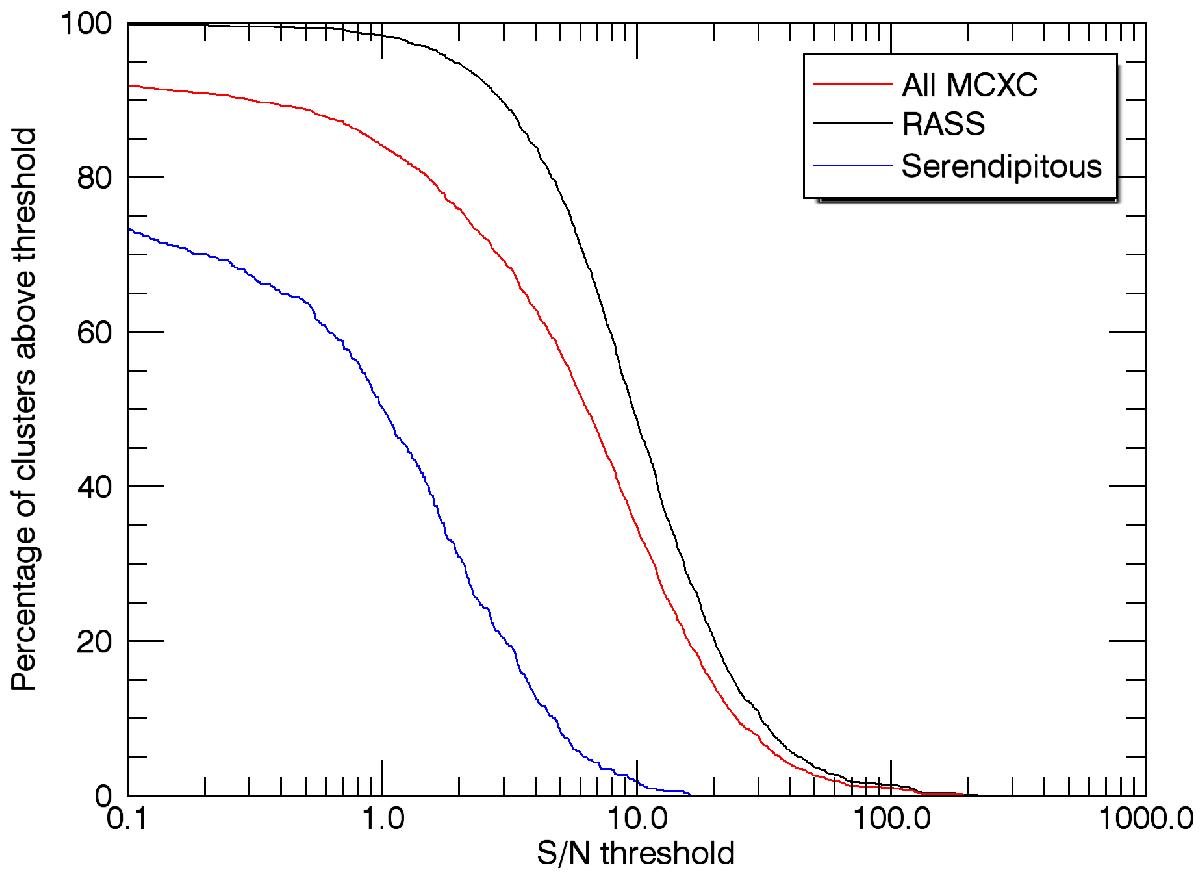
Percentage of MCXC clusters whose extracted S/N, using the proposed X-ray matched filter and assuming the position and size of the clusters are known, is above a given S/N threshold. Red corresponds to the complete MCXC sample, while black and blue correspond to the RASS and serendipitous subsamples, respectively. S/N is defined here as the estimated signal ŝ0 divided by the estimated background noise σθs.
Current usage metrics show cumulative count of Article Views (full-text article views including HTML views, PDF and ePub downloads, according to the available data) and Abstracts Views on Vision4Press platform.
Data correspond to usage on the plateform after 2015. The current usage metrics is available 48-96 hours after online publication and is updated daily on week days.
Initial download of the metrics may take a while.