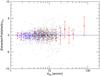
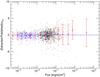
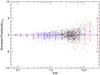
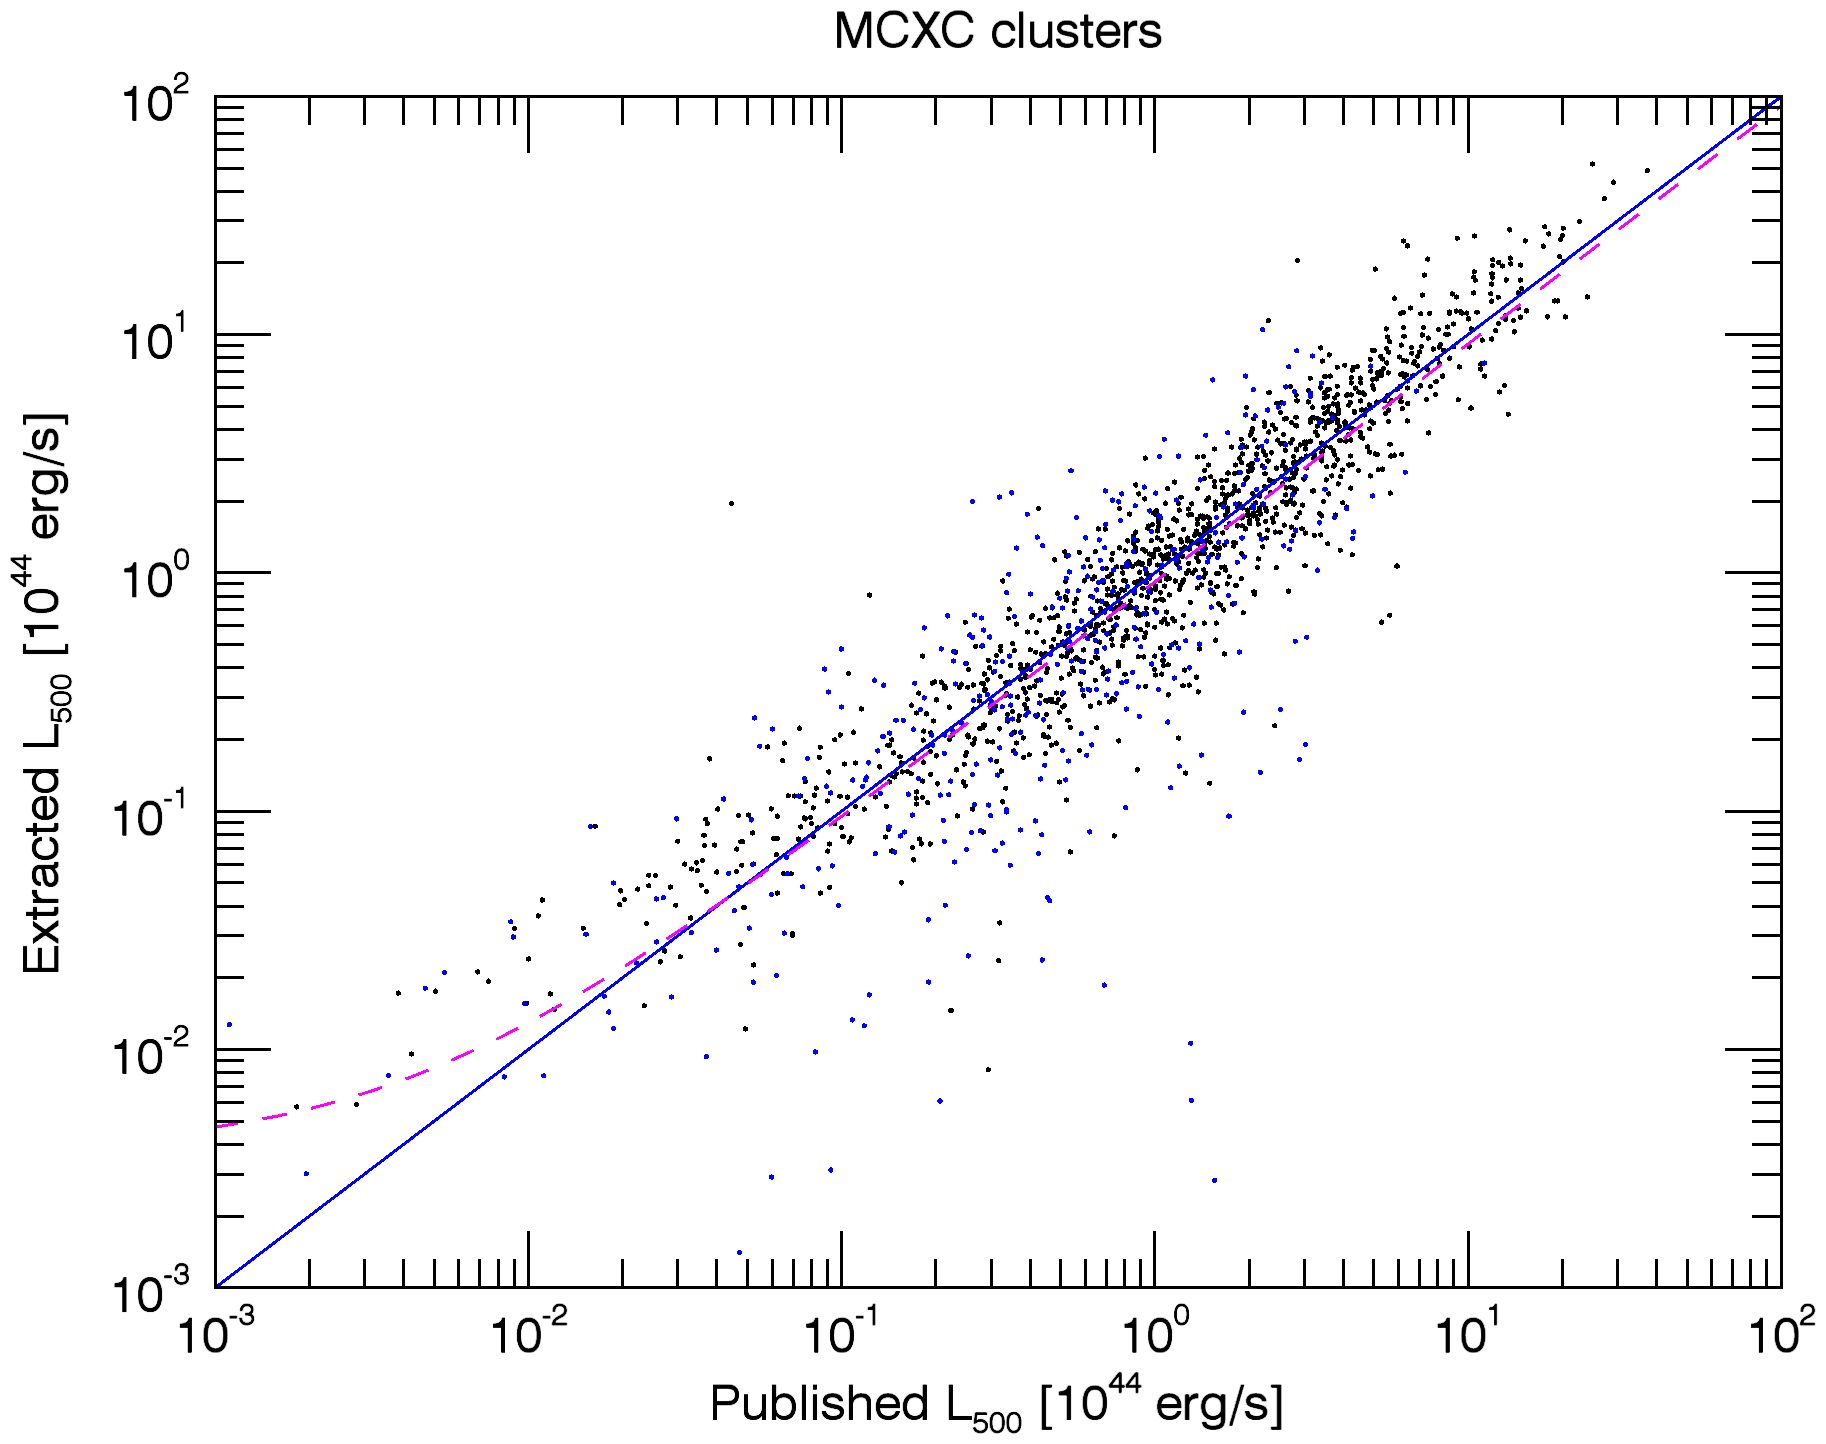
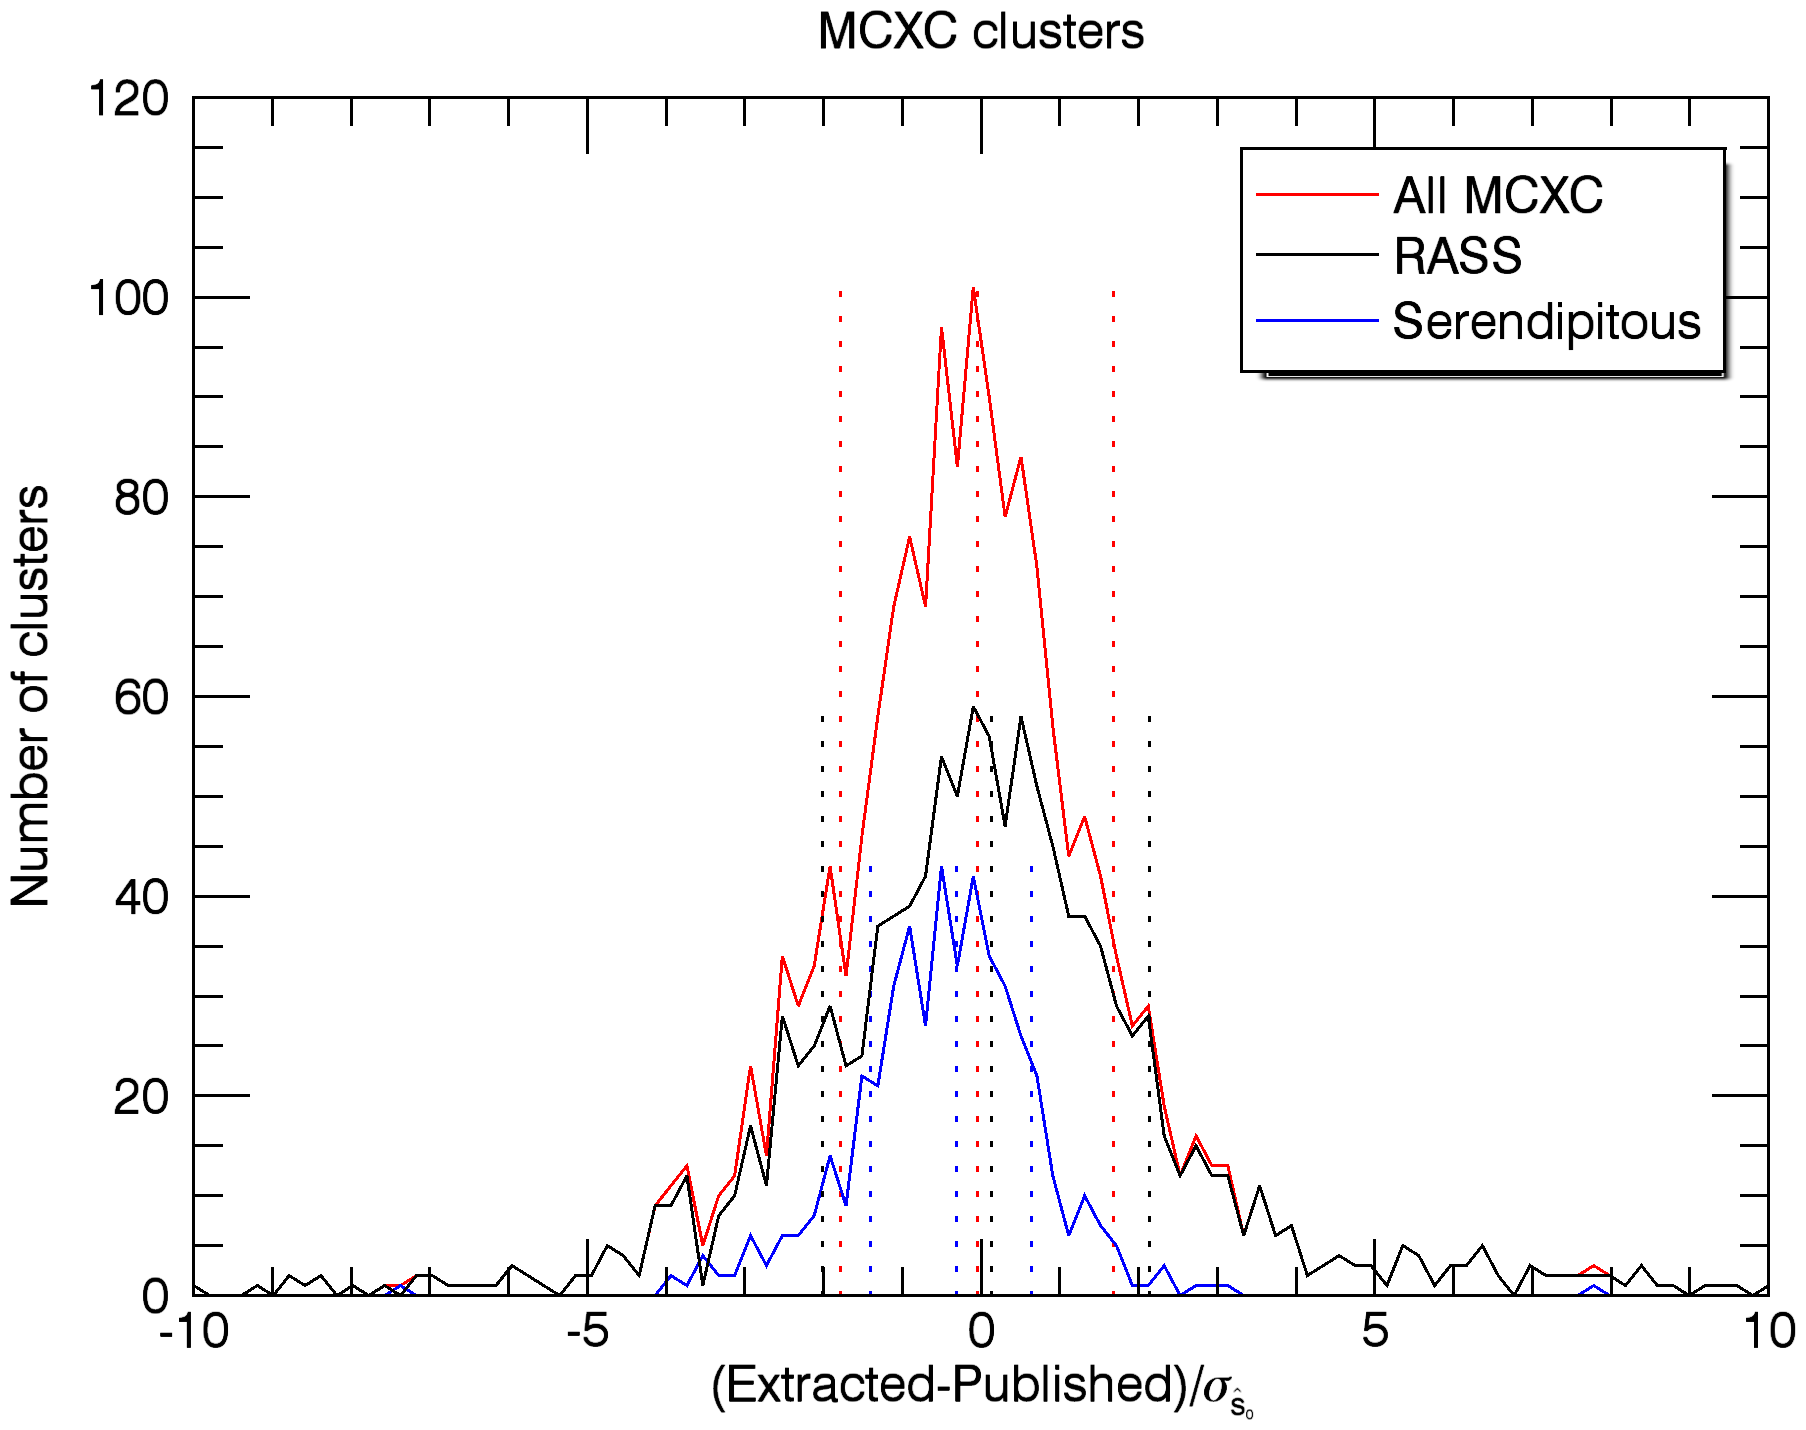
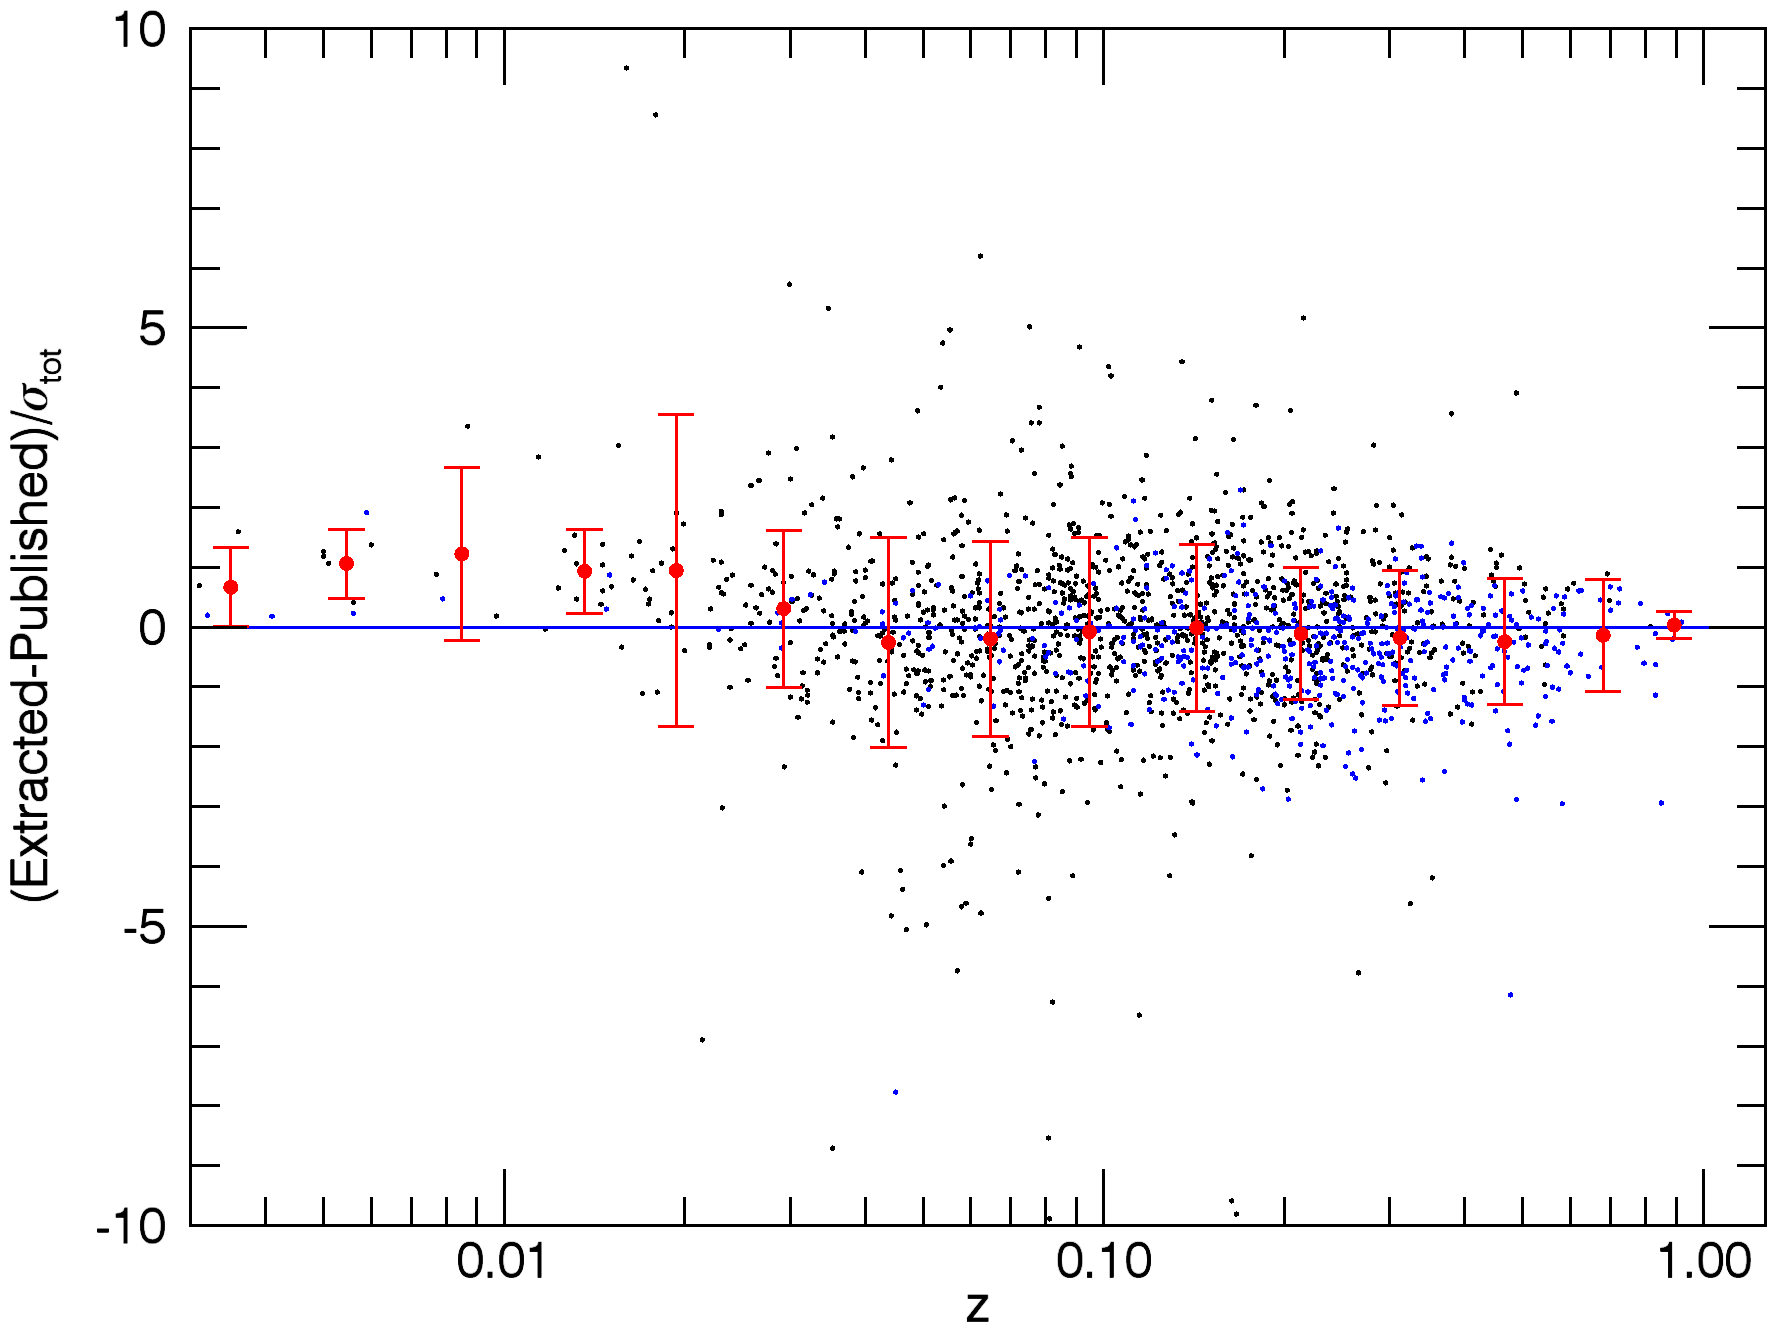
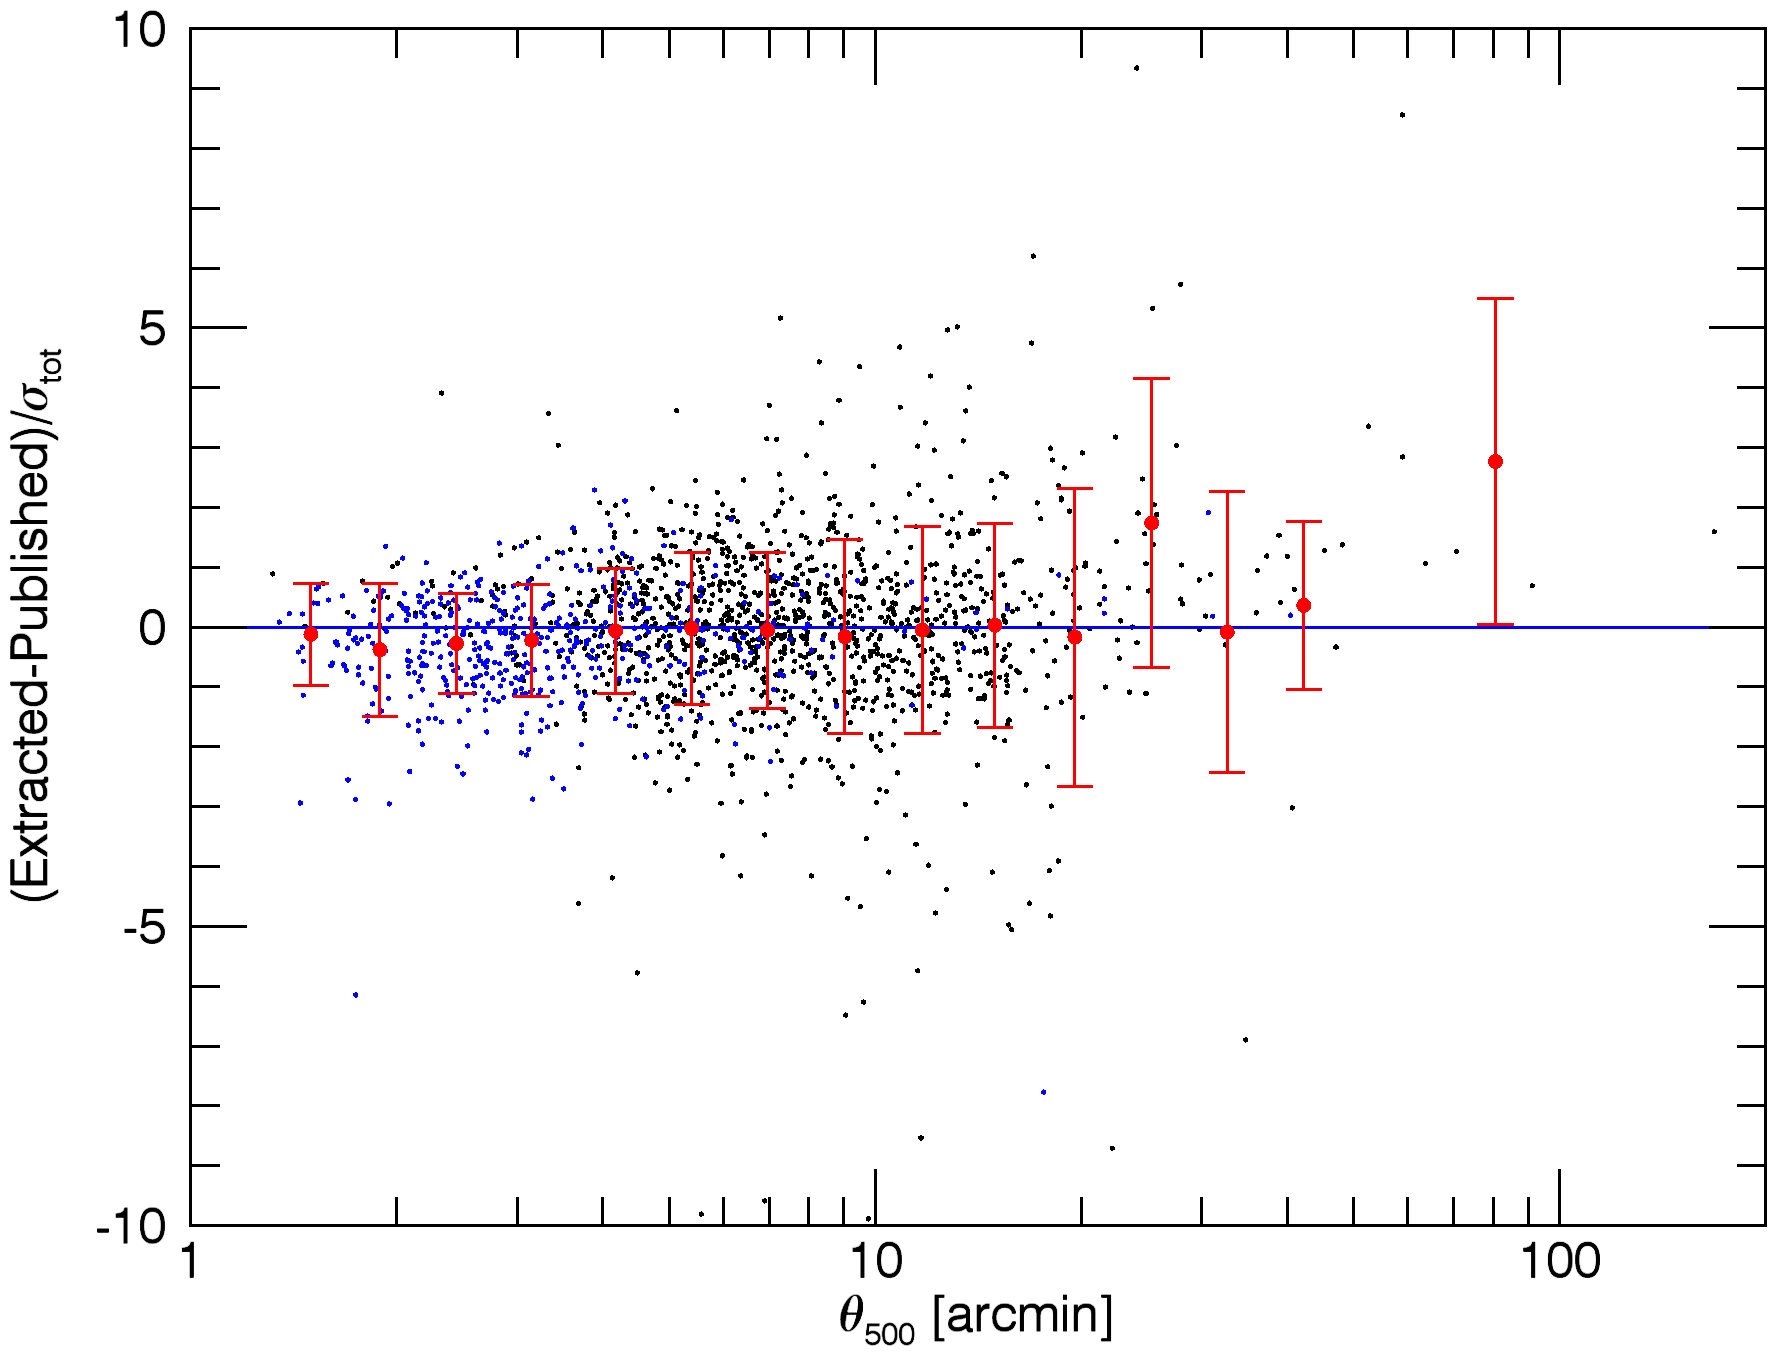
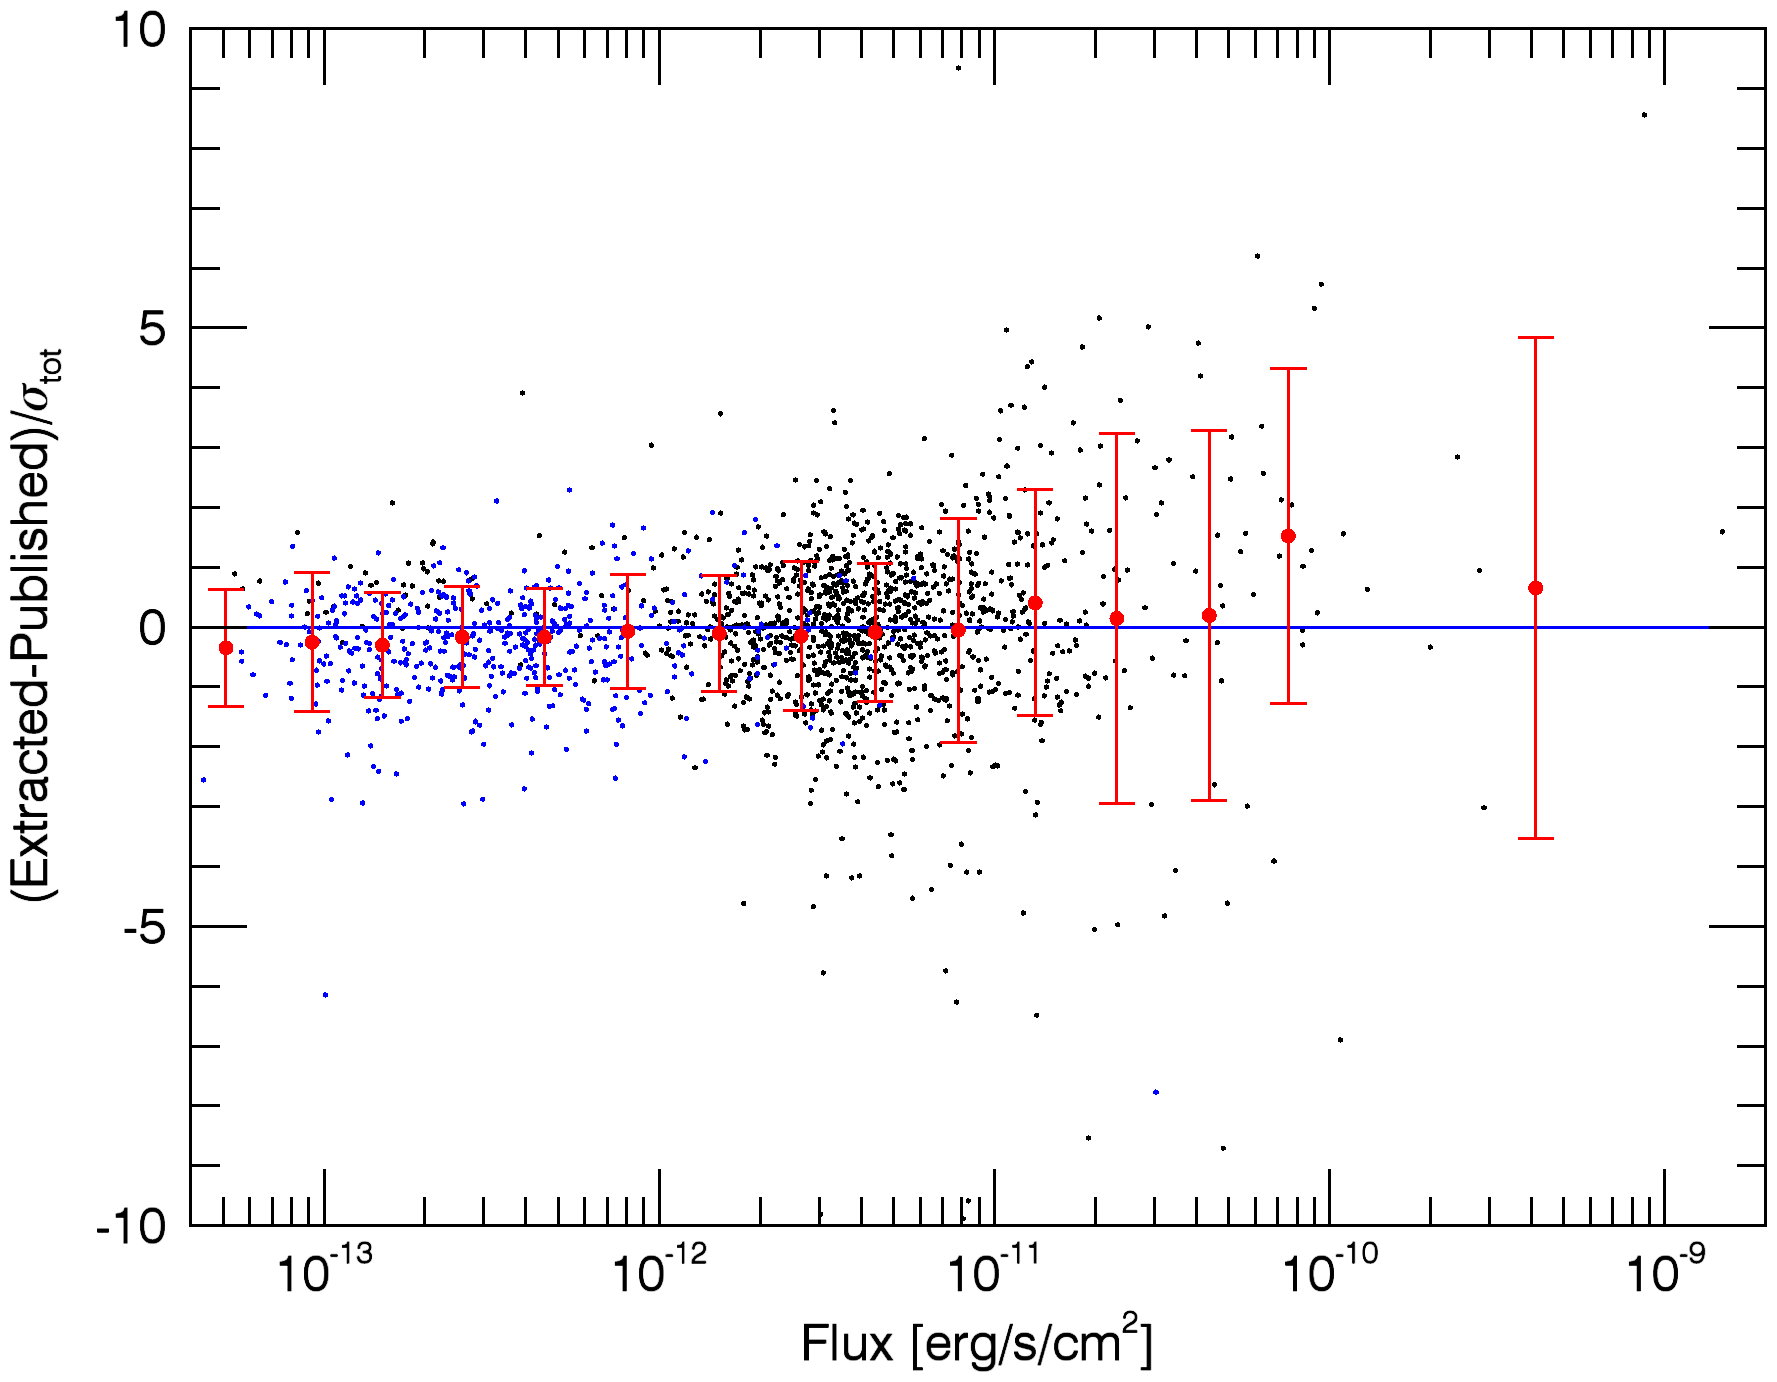
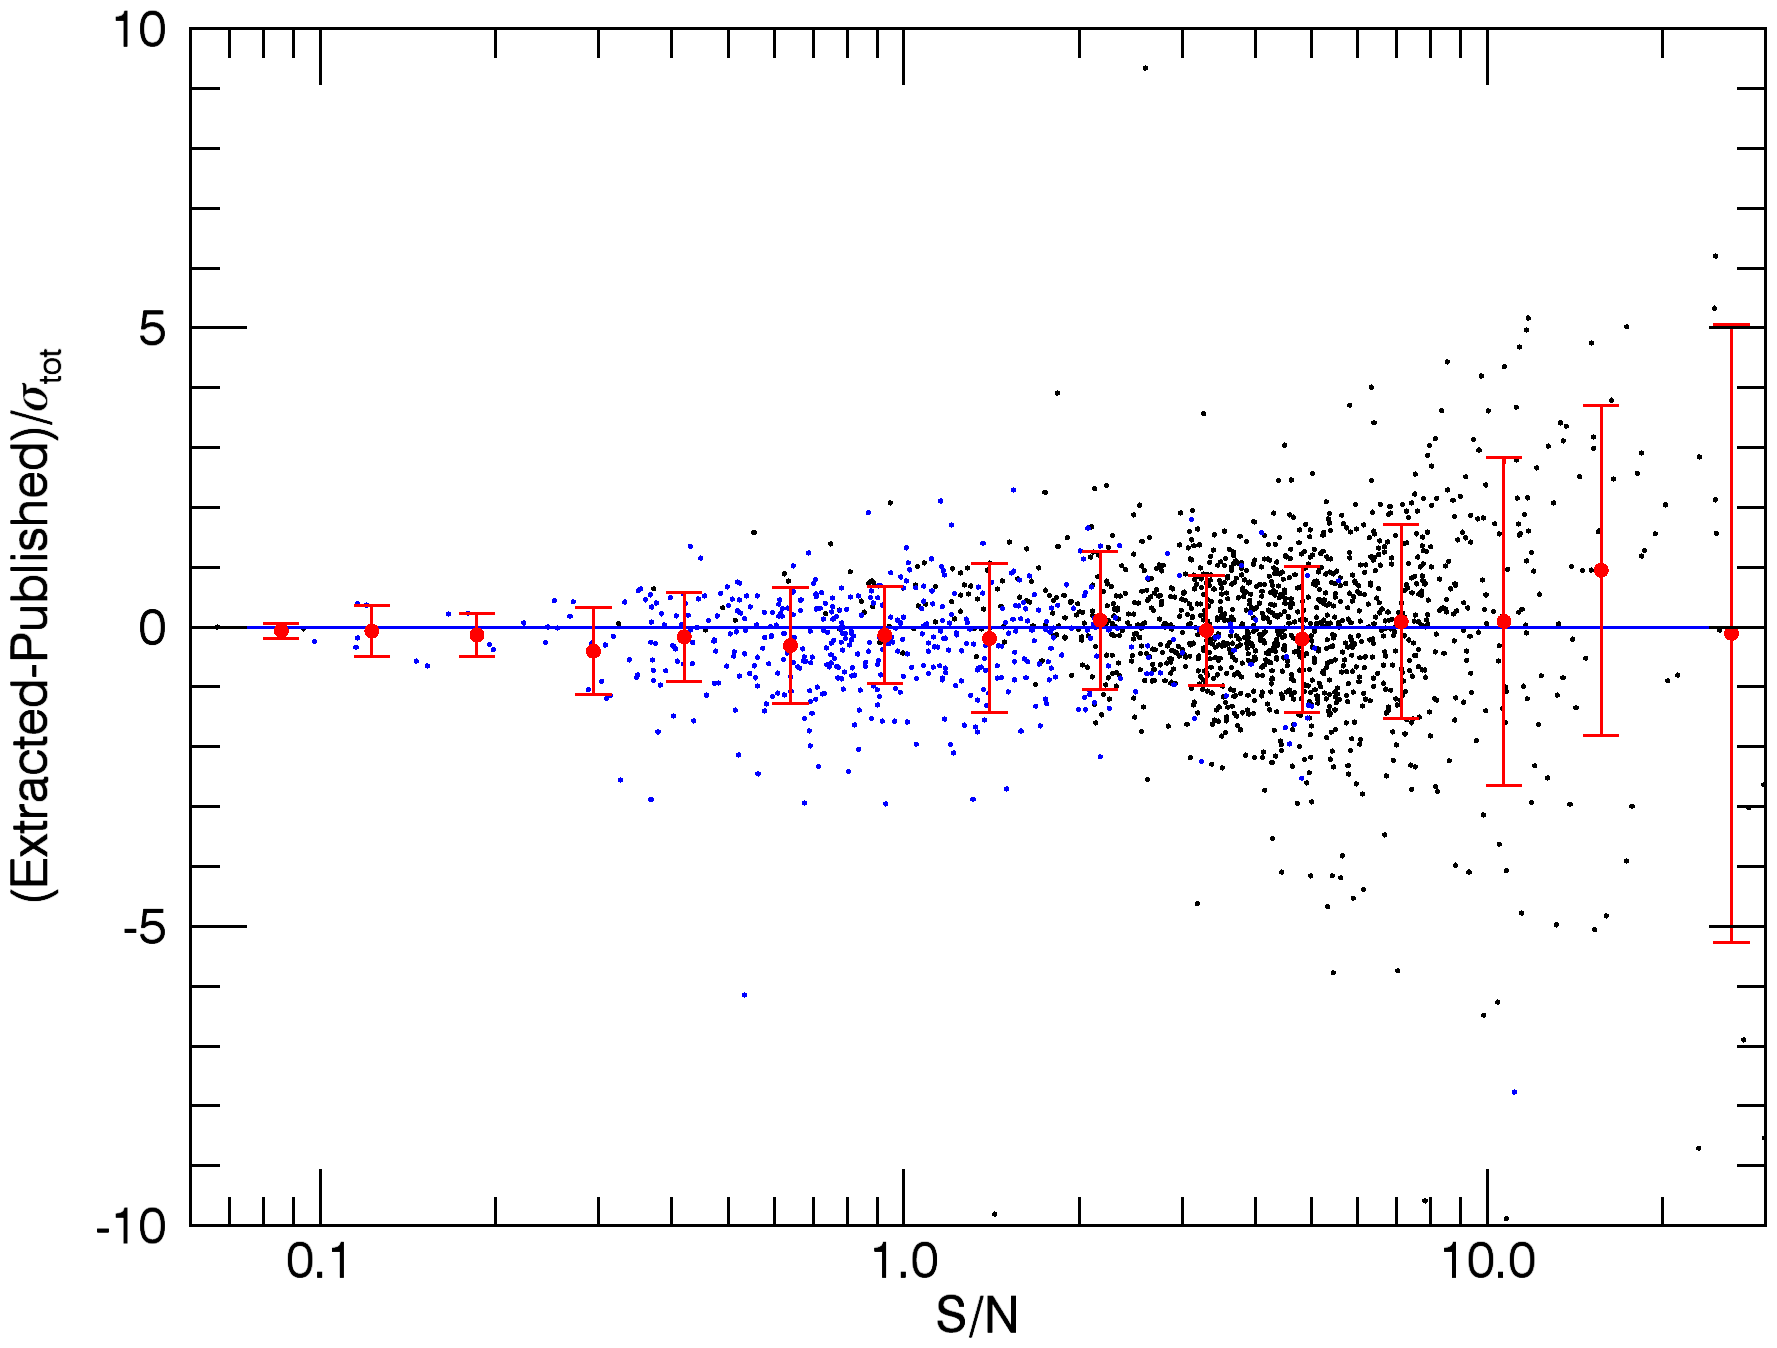
Fig. 2
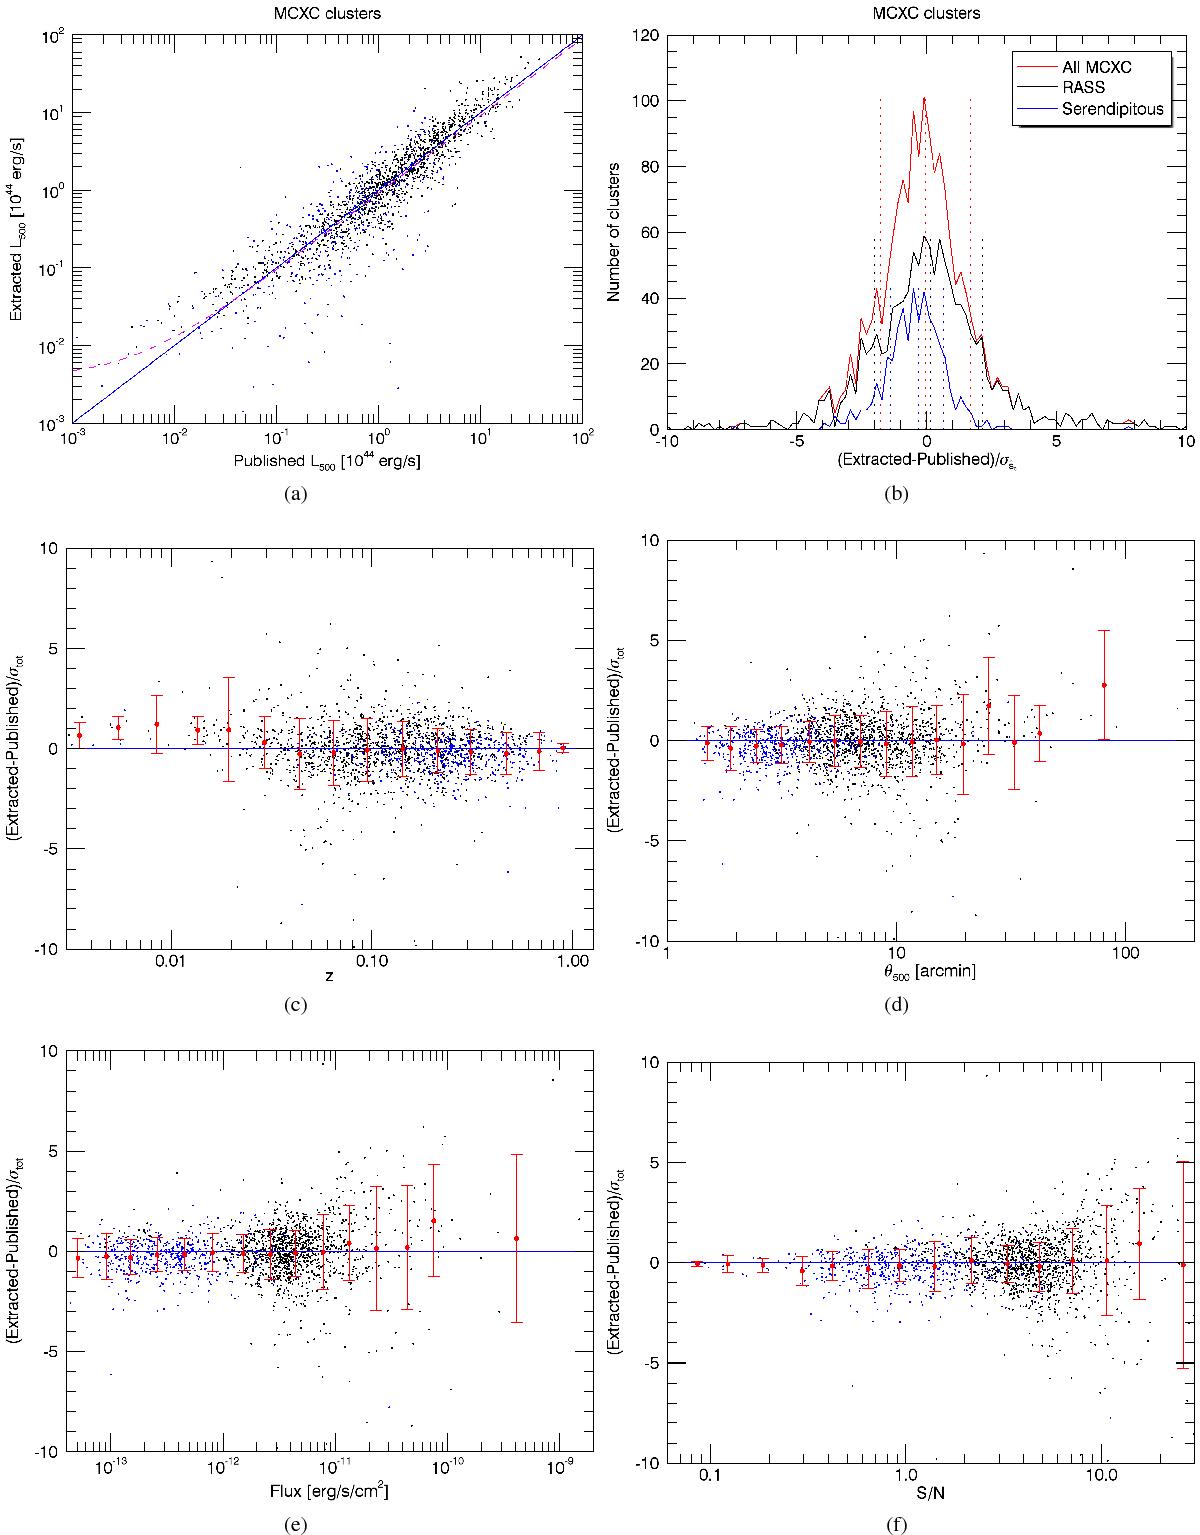
Photometry results of the extraction of the real MCXC clusters using the proposed X-ray matched filter and assuming the position and size of the clusters are known. The six panels are analogous to those in Fig. 1, but comparing the extracted L500 with the published L500. Individual measurements in panels a), c), d), e), and f) are shown as black and blue dots: the black dots correspond to clusters originally detected in RASS, the blue dots to serendipitous clusters. Panel b) shows three histograms that correspond to the RASS clusters (black), the serendipitous clusters (blue), and the complete MCXC sample (red).
Current usage metrics show cumulative count of Article Views (full-text article views including HTML views, PDF and ePub downloads, according to the available data) and Abstracts Views on Vision4Press platform.
Data correspond to usage on the plateform after 2015. The current usage metrics is available 48-96 hours after online publication and is updated daily on week days.
Initial download of the metrics may take a while.