Fig. 18
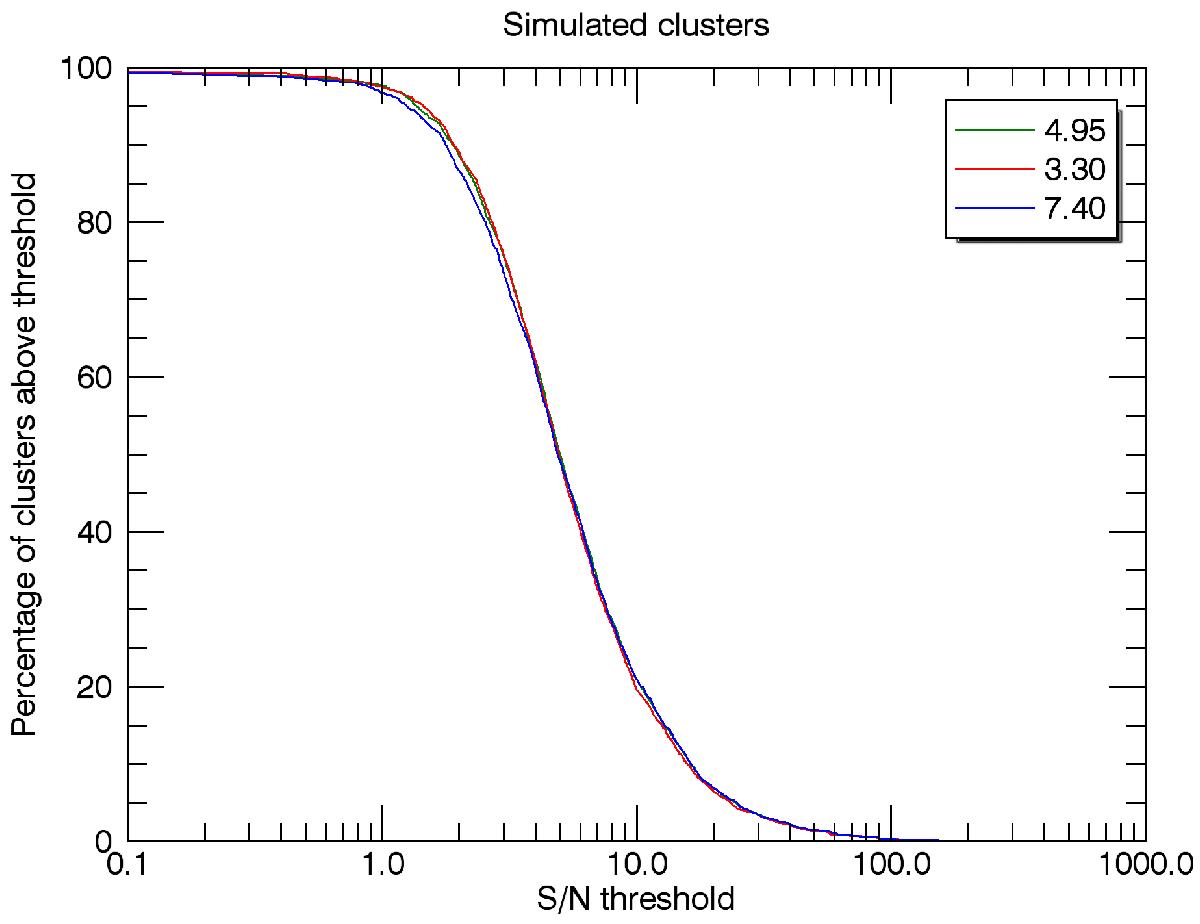
Percentage of simulated clusters (as described in Sect. 4.4) whose extracted S/N, using the proposed X-ray matched filter and assuming the position, size, and redshift of the clusters are known, is above a given S/N threshold. The different colors correspond to different normalizations of the FX/Y500 relation assumed for the extraction, as indicated in the legend.
Current usage metrics show cumulative count of Article Views (full-text article views including HTML views, PDF and ePub downloads, according to the available data) and Abstracts Views on Vision4Press platform.
Data correspond to usage on the plateform after 2015. The current usage metrics is available 48-96 hours after online publication and is updated daily on week days.
Initial download of the metrics may take a while.