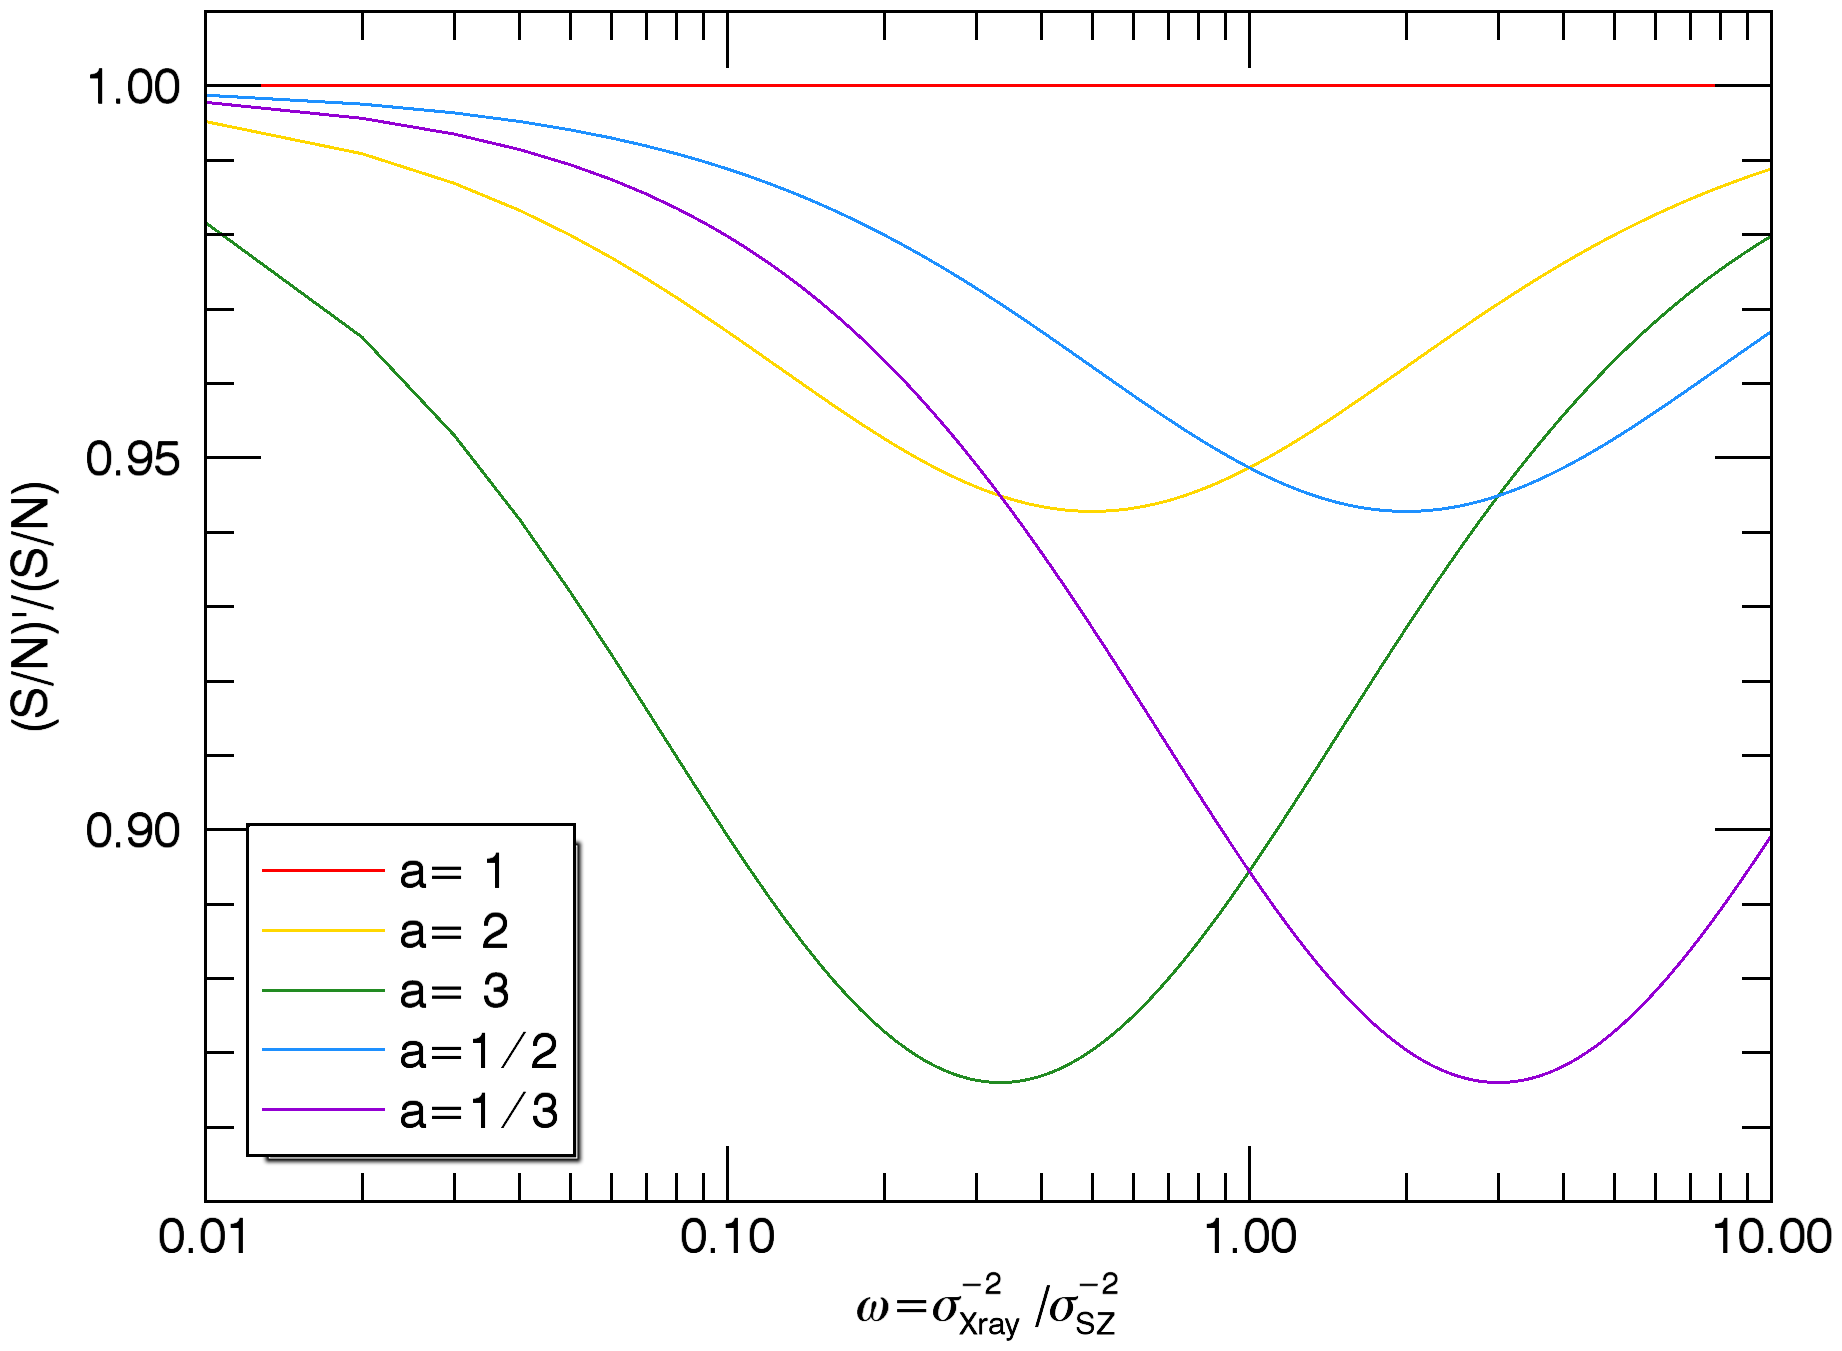
Fig. 16
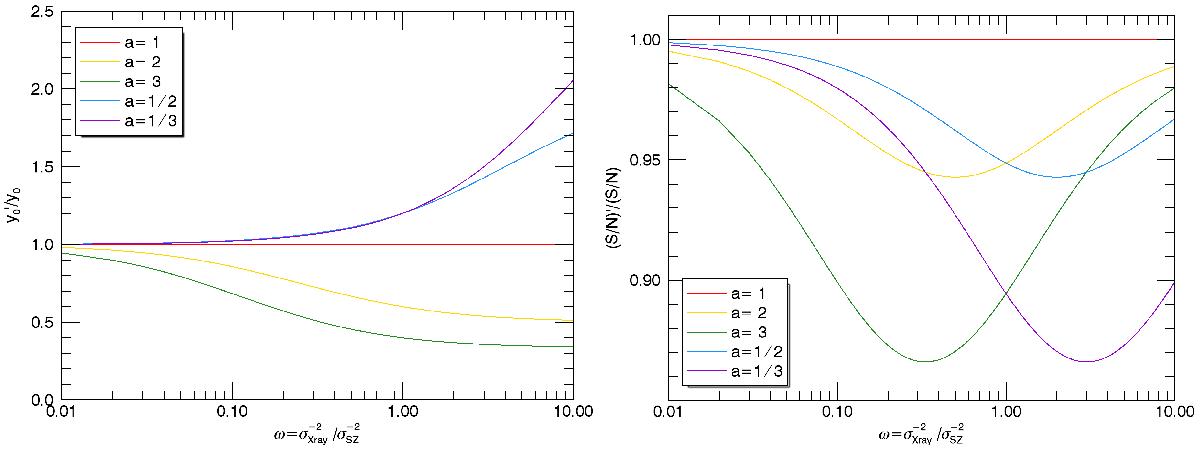
Expected values of the extracted flux (left panel) and the estimated S/N (right panel) when an incorrect FX/Y500 relation is assumed. The figure shows the ratio with respect to the expected value corresponding to the true relation as a function of the relative contribution of the X-ray and SZ background noises ω (low ω values represent better SZ maps and high ω values correspond to a better X-ray map). Different values of a = (FX/Y500)assumed/ (FX/Y500)true are shown in different colors, according to the legend.
Current usage metrics show cumulative count of Article Views (full-text article views including HTML views, PDF and ePub downloads, according to the available data) and Abstracts Views on Vision4Press platform.
Data correspond to usage on the plateform after 2015. The current usage metrics is available 48-96 hours after online publication and is updated daily on week days.
Initial download of the metrics may take a while.